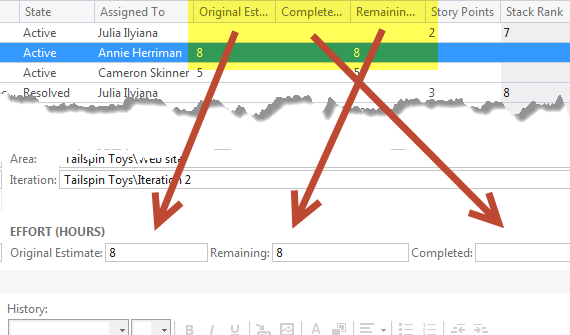
One of the information requested by Project Managers is knowing how good was task estimation in the past , and thanks to TFS gathering this data is really simple. If you look at the sample data in Brian Keller’s virtual machine for Project Tailspin Toys you have three field related to estimation of task, as visible in Figure 1.

Figure 1: The three field of MSF For Agile that are used to track estimation and work done on task
As you can see the field Original Estimate is used to do an initial estimation of hours needed to accomplish a task, while Remainingand Completedwork are used to track progress. The Original Estimate should never change and developers should track down work using the other two fields. If you open the Task Board you can find the Remaining work represented as number in bold in each task card.
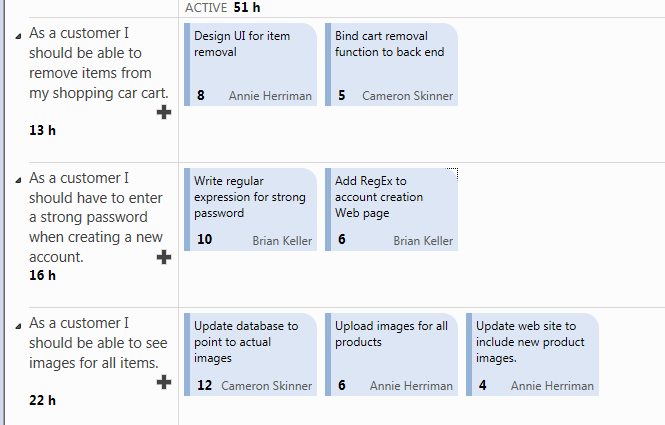
Figure 2: Task Board showing active tasks and remaining work for each of them.
You can change values directly from the task board, suppose you are working at the “*update database to point to actual images”*task, you worked for the whole day (8 hours) on it but a the end you estimate that you need other 7 hours of work, because you did less than half the work. If you think that is difficult to understand if you did more on less than half the work lets depict a more standard scenario: you worked for 5 hours to the project so you change remaining work from 12 to 7 to reflect this simple fact.
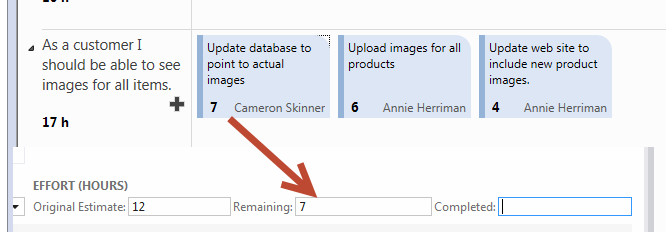
Figure 3: Changing value on the taskboard affects the Remaining work.
This change is reflected in the Remaining field, and you should also write down in completed work field the real amount of work you did, in this example the number 5. The purpose of time tracking is understanding if a task was completed on time. The simplest thing to do is adding number of worked hours to Completed field and estimating number of hours remaining, nothing else. Now you continue to work on the task, the following day you work for 7 hours on it, but at the end of the day you verify that you should do more work, and you estimate it to need 2 hours more. You should write down 2 in the Remaining and 12 into completed. Next day you work for another 4 hours to the task and close it, now you can write zero in the remaining and 16 in the completed.
Now you know that the task was underestimated, simply because you told that it would need 12 hours to be completed, but it requested 16 hours; this information is not reflected in the Task Board, where only remaining works is represented. This is good because this kind of information is not suitable to be visible to all the team, because the Task Board purpose is not to put shame on team members, showing how good/bad a developer is in estimating task , it serves also the need to understand how many work remained and the various status of each task. Such an information is useful only for management, it is interesting to know who is better in estimating, or areas where the team is usually bad in estimating especially to avoid making same mistake in the future.
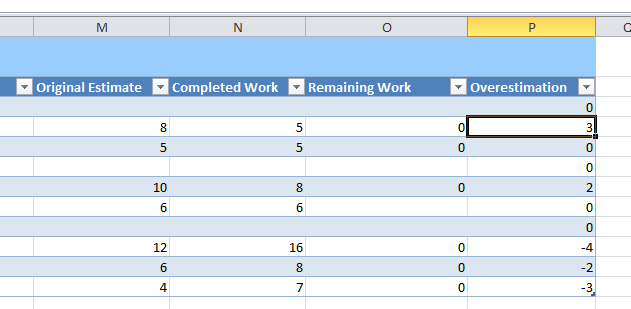
When all task are completed you have zero on each Remaining field and you can do calculation based on Original Estimate and Completed work. The easiest way to work with such numbers is to use excel , you can just press “Open in Microsoft Office” –> “Open Query in Microsoft Excel” to open in excel the query of the current iteration, or a query that comprehend all task for all past iterations, now you can simply add a column to calculate the difference between the Original Estimate and the Completed fields.

Figure 4: Create a simple column with a formula that subtracts Completed Work from the Original Estimate
You can simply select a row, type the equal sign to create a formula and select the Original Estimate, then press minus sign and select the Completes Work and press Enter, the game is done and you can see a column with negative sign where developer overestimated the task. The good point in using Excel is that is a really simple tool to manipulate and represent data , if you need to know overestimation for each developer you can simply add a pivot table, choose the Assigned To and sum the Overestimation value and you got the table in Figure 5.

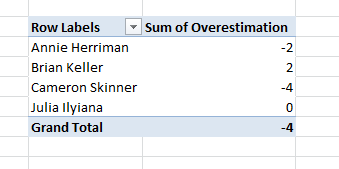
Figure 5: Pivot table to have a visualization of Overestimation by developer
If such an information seems to be somewhat “punitive”, remember that it is not meant to be used to punish anyone, but only to give management an idea on what to expect in the future. You can simply gather data and if a developer is constantly underestimating you can simply apply a multiplier factor on his estimation or simply suggest him/she to be less optimistic. You can also pivot table by area.

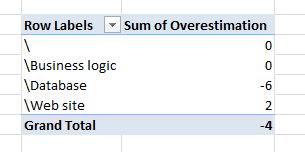
Figure 6: Pivoting by area gives you an idea of areas where underestimation is more common
From Figure 6 you can verify that the real cause of Overestimation is database area, so you can ask team to brainstorm on it and find the three main pain points they had when they work in task related to database. This is done to understand if such an overestimation has a cause that can be solved or it was simply due to overoptimistic assumptions. If an area is constantly overestimated, usually it hide some problem that developers ignore during estimation. As an example you could discover that people needs lots of time to replicate data in dev machine to test new database code because they need to work on real data, database should be big enough to test in a real scenario, and restoring/testing such big data is the major time consuming task they had. In such a situation it is possible to use SSD disk and faster machine to create a Dev instance of SQL that can speed up working on test db, but the more important point is: if you have no number and task are constantly closed late, you have no clue in what to do to improve the situation and is really difficult to understand how improve the process.
Gian Maria.