I want to share with you an history of a problem we had in production last week, because after lots of internet search no article lead us to find the solution, so I hope that this article can help you if you experience the very same problem.
Situation: we deployed new version of a web application based on ASP.NET Web API, it was a small increment (we deploy frequently), but suddenly the customer starts experiencing slowness of the application and intermittent errors.
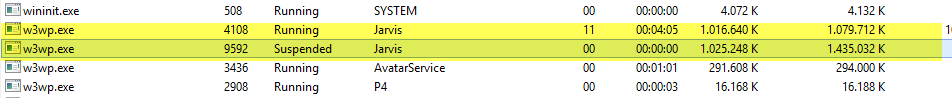
Logging into the machine we found a real strange situation, shown in Figure 1 we have two worker process for the application, one is running and the other one is in Suspended state, but it is using lots of RAM.
Figure 1 : Two worker process in the same machine, but one is suspended
In Figure 1 , the running process used 4 minutes of CPU time because this screenshot was taken after a process recycle, but we had situation where the running process was alive for more than 10 hours, and the suspended process has consumed not a single second of CPU.
In production server, suddently, another worker process (w3wp.exe) started, in suspended state, starts consuming RAM, then disappear.
If you search in internet, you can find lots of article related to process recycling, but this is not our situation, because the process does not get recycled. This is our usual situation on that production server
– Our process usually consume 1.5 GB / 2.0 GB of RAM
– Production machine has 8 GB of RAM
– We had other services in that machine, but usually total memory consumption is around 6 GB / 7 GB
Performance of the application is good, we use almost all the memory of the server, but we never experienced problems. Now, after the last deploy, periodically we see this exact series of events from Task Manager :
*– Another w3wp.exe was launched, it has the very same IIS user (jarvis) and the very same command line of the existing instance of w3wp.exe
– That process is in state suspended, but it starts allocating RAM
– That process is a child of the original w3wp.exe process
– The web application works normally, all requests are handled by the original w3wp.exe process and the site responds quickly
– Suspended process continue to grow in RAM usage, until it arrives approximately to the working set of original w3wp.exe process, then it is closed
– the original w3wp.exe process was not recycled and continue worked perfectly *
The real problem is memory usage, because when this sequence of events starts, the machine starts experiencing memory pressure and everything is really slow, sometimes a third w3wp.exe suspended process starts and this bring down the performance of the machine 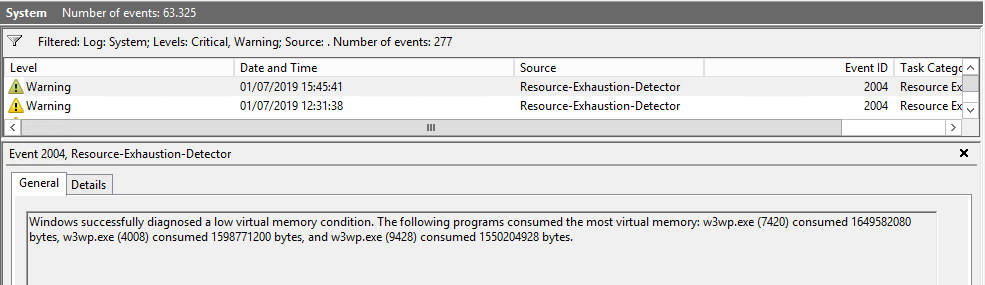
Figure 2: Windows detects low memory, and w3wp.exe process is the problem
This is the problem when you did a good dimensioning of the machine, when something out of your control happens and some process is using more resource, performances starts to go down.
If you try to kill the new w3wp.exe suspended process, its working set drops to 4k, but it remains suspended and cannot be killed. This is a nasty situation, because performance of production server was poor, and the only workaround was adding another RAM to the virtual machine , but we really hate wasting RAM for unnecessary task.
After a couple of hours of searching we were frustrated because: 1) This has nothing to do with Recycling, the original process was not recycled, every article in the internet refers to some recycling problem 2) This happens only after last deploy, but we really did not change a lot the code in the last sprint
3) Whenever a w3wp.exe suspended process appears, it reach the same amount of memory of the official w3wp.exe process before disappearing, this is important because the new process must be related to the old one.**
The only possible reason for this behavior is that something is creating another process in suspended state to create a dump of production w3wp.exe process
When you take a memory dump of a process it will freeze for the duration of the dump, but you can also spawn a new process, copy memory and then dump the other process. With this technique the original process continue to run.
Armed with this intuition we start searching for *.dmp files in all disks, and immediately we found a temp folder with some dump of 1.7 GB size. Bingo: this confirms our hypothesis, something is creating dump, and this creates too memory pressure. > By carefully analyzing what happened the only explanation of the issue is “something is creating dumps of w3wp.exe process.
Now we start searching for the possible culprit and after some unsuccessful search on internet (we found tons of article related to lots of reason but noone was applicable to our situation), we were a little bit frustrated.
This is the problem when your production server does not works well, you feel in an hurry and you made mistake, since we located the.dmp file we can simply use SysInternal Process monitor to verify what process was reading or writing in the folder containing dump. BINGO we have a process call3ed SnapshotUploader64 that was using that file, and finally we immediately understand what happened, for some reason the web application has Application Insight Snapshot debugger enabled. 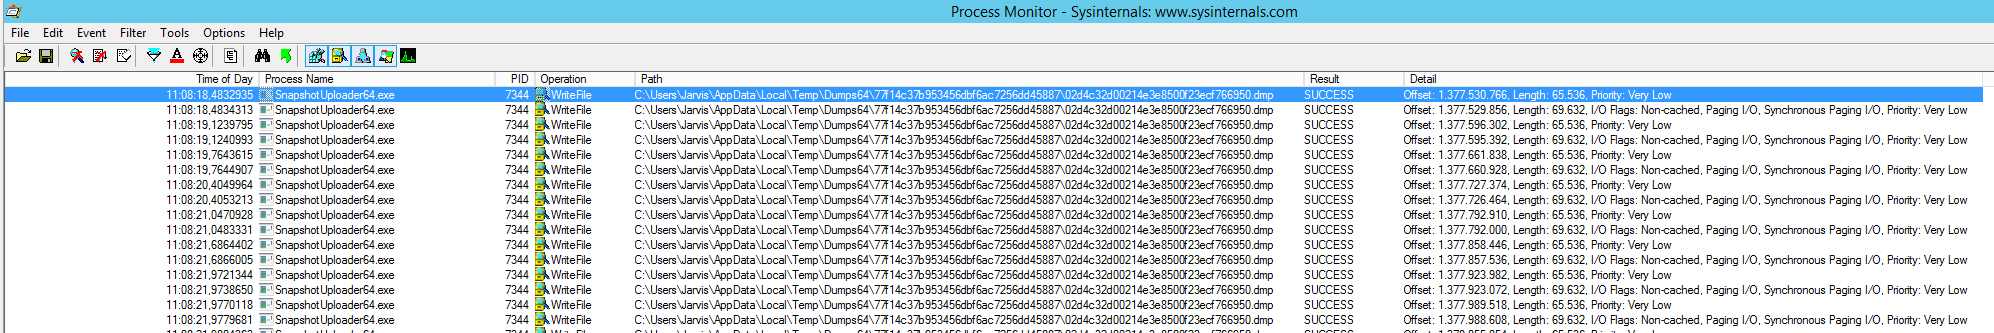
Figure 3: SysInternal process monitor shows you what process is using file and it is an invaluable tool to understand what is happening in your machine.
Looking at the source code we found that in this sprint we updated reference to Application Insight library and the nuget packet changed Application Insight configuration file enabling Snapshot Debugger of the site, no one in the team realized this, because was nothing we discussed.
This is a general rule, whenever you update nuget packages, always look at config files, because sometimes packages post update action manipulate them in a way that can cause problem.
Snapshot debugger is a really nice feature, you can read more here, it has a real nice feature that uses a Snappoint where the original process is forked in a new process that is immediately suspended. Reading the documentation we found that:
The snapshot is not a copy of the full heap of the app – it’s only a copy of the page table with pages set to copy-on-write. The Snapshot Debugger only makes copies of pages in your app if the page gets modified, minimizing the memory impact on your server. In total, your app will only slow down by 10-30 milliseconds when creating snapshots. As snapshots are held in-memory on your server, they do cost ~100s of kilobytes while they are active, as well as an additional commit charge. The overhead of capturing snapshots is fixed and should therefore not affect the throughput of your app regardless of the scale of your app.
But this is absolutely not true, in our situation, because forked process consumed lots of RAM. We choose not to investigate why, but instead we disabled snapshot debugger from web config and the problem went away.
It was a long morning, but our server is up and running at full speed again :)
Gian Maria.