In previous post I’ve explained how to move searches component in a different machine in a TFS 2018 installation, now it is time to understand how to monitor that instance. First of all you should monitor the folder that physically contains data, in my installation is C:\tfs\ESDATA (it is a parameter you choose when you configure the Search Server with Configure-TFSSearch.ps1 -Operation install PowerShell script). Data folder should be placed on a fast disk, usually SSD are the best choice. If the SSD will ever fail, you can always restart ES with empty data folder and use scripts to force TFS to reindex everything.
Data in ElasticSearch can be wiped away without problem, like WareHouse database, its content can always be restored.
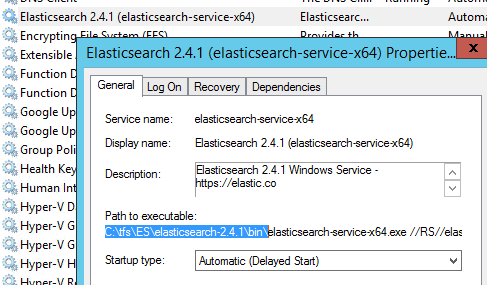
If you want to have a better idea on what is happening to your search instance you can install plugins to easy management. First step: connect to the machine where the Search Service is running and locate the folder where ElasticSearch was installed. A simple trick is checking corresponding Windows Service.

Figure 1: Locate ElasticSearch binaries from Windows Service
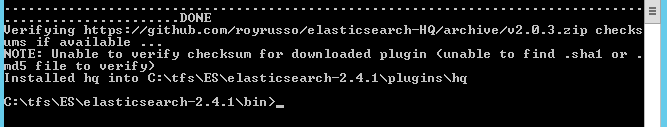
Now simply open a command prompt and change directory to the bin installation directory of ElasticSearch , from here you can install various plugin to simplify ES management, I usually starts with the HQ plugininstallable with the simple command
plugin install royrusso/elasticsearch-HQ/v2.0.3
You should check the correct version in HQ home site, version 2.0.3 is the latest version that works with ES 2.4.1, the version used by TFS Search Service. For this command to being able to run, the machine should have an internet connection and GitHub site should not be blocked.

Figure 1: HQ was correctly installed
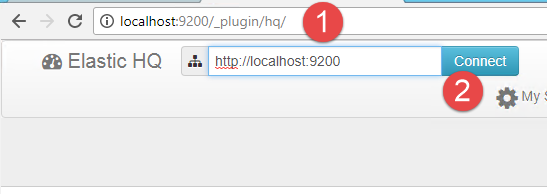
Now you can just browse to http://localhost:9200/_plugin/HQ to open the web interface of HQ plugin and connect to the actual instance. 
Figure 3: HQ plugin up and running and ready to be connected to local instance of ES.

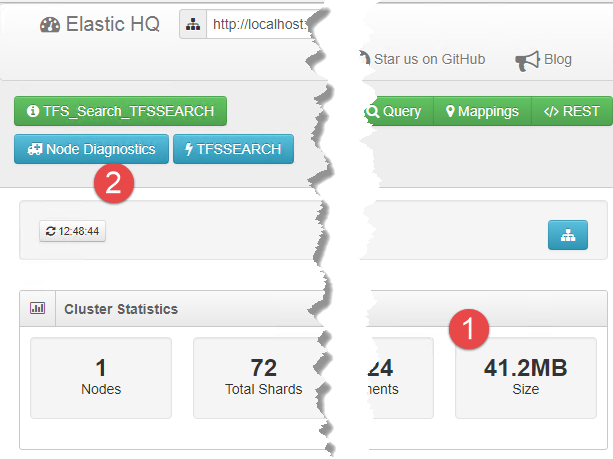
Figure 4: Home page of HQ, where you can find the total size used by the server (1) and you can also have some Node Diagnostics (2)
From Node Diagnostics tool you can find if some statistics are not good , in my example I have search server in a server with slow disk and query time is sub-optimal. Usually ES is supposed to answer in less than 50 milliseconds, in my installation I have an average time of 660ms.
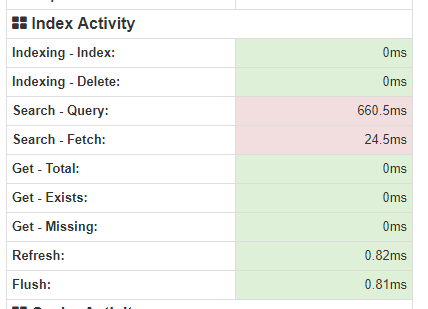
Figure 5: Statistics on search.
If you move the mouse over the number, it can give you some hint on the reason why the specific number is calculated and why is not considered to be good.
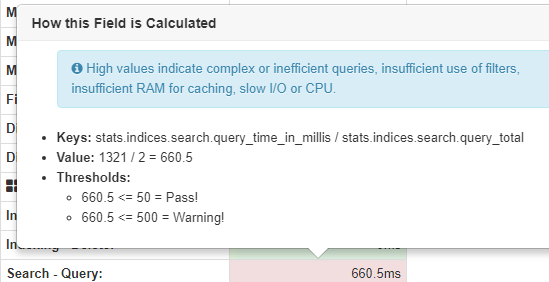
Figure 6: Help on the various number gives you an idea on what is wrong and how you could solve this.
If you are experienced slow search, there are many factors that can impact the instance of ElasticSearch and using a good plugin for diagnose the real root cause of the problem is usually the best approach.
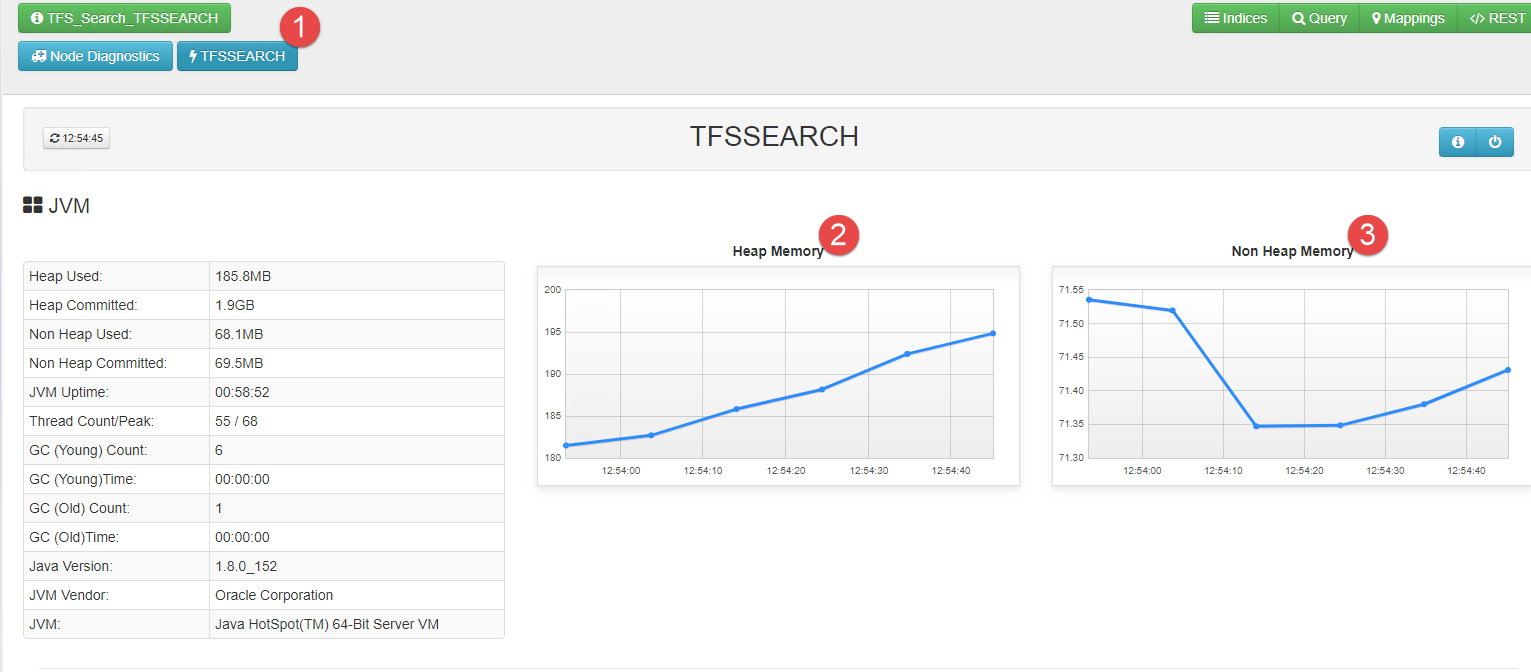
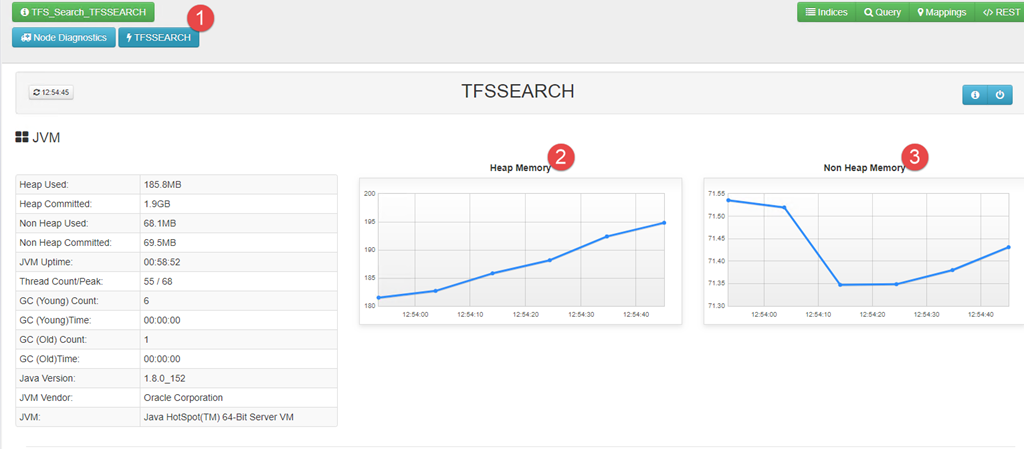
I suggest you to navigate in HQ interface to familiarize with the various information it can gives to you, especially clicking on the name of a single node (there is only one node in my installation), you can get some interesting data on that single node , especially on RAM usage.
Figure7: Ram usage of a single node.
There are lots of other plugins that can show lots of useful information about your ElasticSearch instance, the installation is similar to HQ and you can install and use them with very few clicks.
Gian Maria.