Analyze your project with SonarQube in TFS Build vNext
When you have your SonarQube server up and runinng it is time to put some data into it. You will be amazed to know how simple it is with build vNext and Visual Studio Online.
Installing the analyzer
As a prerequisite, you need to install Java on the machine where the agent is running, then download the Msbuild.SonarQube.Runner, unblock the zip and unzip everything in a folder of your HD. Make sure that PATH contains that folder so you are able to launch the runner from any command prompt.
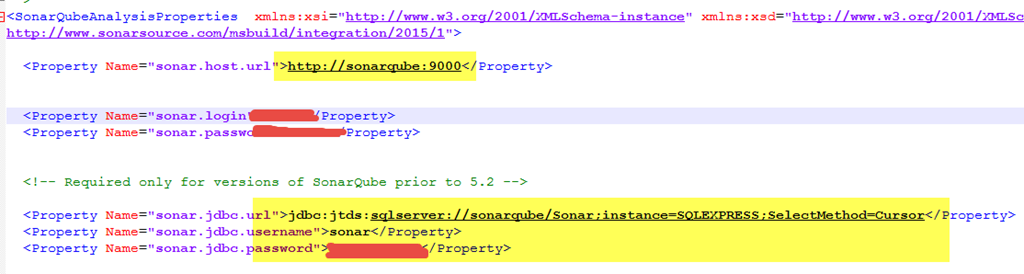
Then open the SonarQube.Analysis.xml file, and change configuration.

Figure 1: Configuration of Msbuild SonarQube runner
Remember that you need to open firewall port of the server where SonarQube database is running, because the agent will connect directly to the database to save result of the analysis. This is a common source of errors, because you can incorrectly think that the agent is capable to talk with the server through an endpoint (it will be available in next versions of SonarQube)
Pay attention because the Agent directly save result on Database.
Remember also to install the C# plugin or whatever plugin you need (Ex Visual Basic.NET) to support the language/technology you are using.
Manual analysis
On the machine where the vNext agent is running you need to be sure that everything is ok. Just open a command prompt and navigate on a folder where you have the project you want to analyze (you can use _work folder of the agent). Once you are in a folder where you have a.sln file you should start analysis with this command.
| |
This command will connect to SonarQube server and will download analysis profile. Then you should launch msbuild to compile the solution and finally you should do the real analysis running the end command
| |
Be sure to verify that everything works with manual analysis, because it will require less time to troubleshoot problems
If everything goes well you should see some data inside your SonarQube server. Doing manual analysis is a must so you are sure that Java is installed correctly, firewall ports are ok, DNS names are ok and so on. Once you can do a manual analysis you are 99% sure that the analysis will be good even during the build.
Running in Buid vNext
If everything is ok, I just suggest tagging the agent with SonarQube tag, to identify this agent as capable of doing SonarQube analysis.
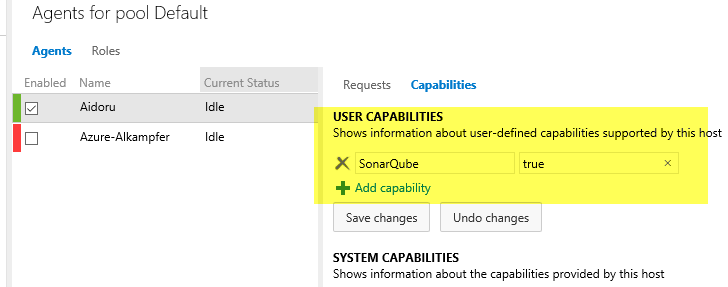
Figure 2: Adding custom capability to the agent
Now the build must be changed to require this specific capability for the agent.
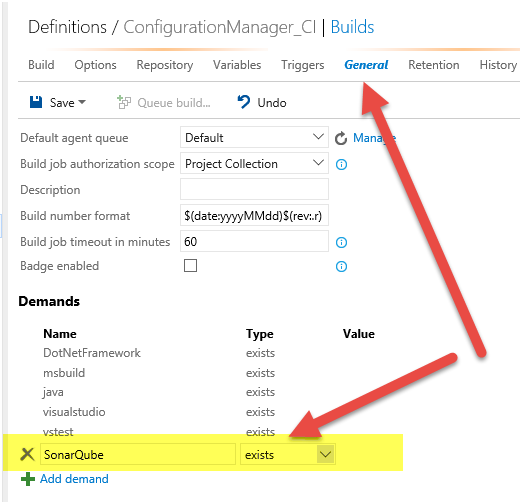
Figure 3: Adding Demands on the build to request specific capabilities
Using custom capability is a good way to communicate to people that someone did manual testing of SonarQube runner on that machine, so you can be pretty sture that the build will not encounter problems.
Using custom demands will make your life easier because you are explicitly telling what that agent can do.
Now you can customize the build to launch the above two command line script to do the analysis, as you manually did before. You can do similar steps if you are using XAML Build, just add a script to launch start analysis pre build and the end after tests ran.
But if you are using build vNext you will be happy to know that SonarQube runner tasks were already present in VSO/TFS vNext. 
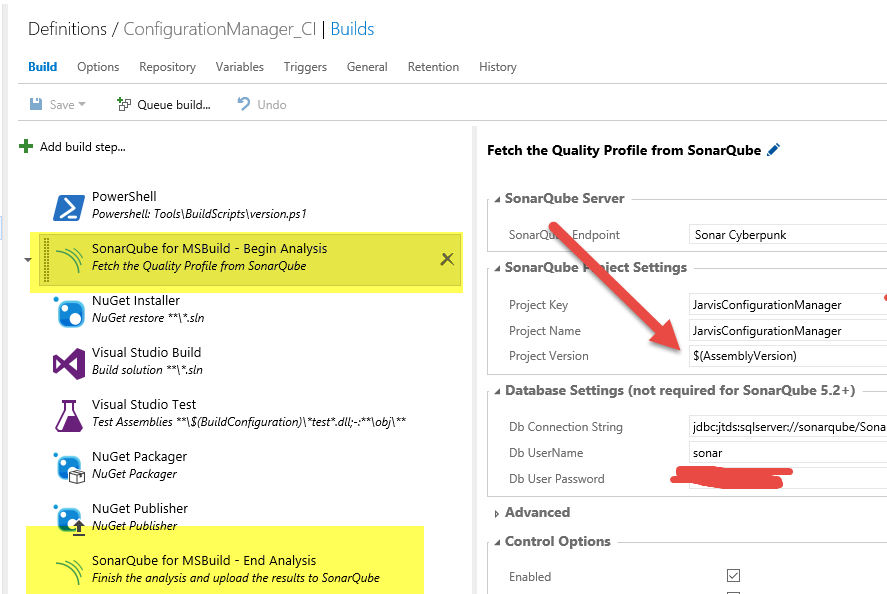
Figure 4: Configure SonarQube analysis in your build.
Only begin analysis task needs configuration, and you needs only to specify the same informations you saved in SonarQube.Analysis.Xml file. Since I’m using the build where I’ve configured Semantic Versioning with GitVersion I’ve also a build variable called AssemblyVerision that is automatically set by GitVersion and I can use it to specify the version to SonarQube.
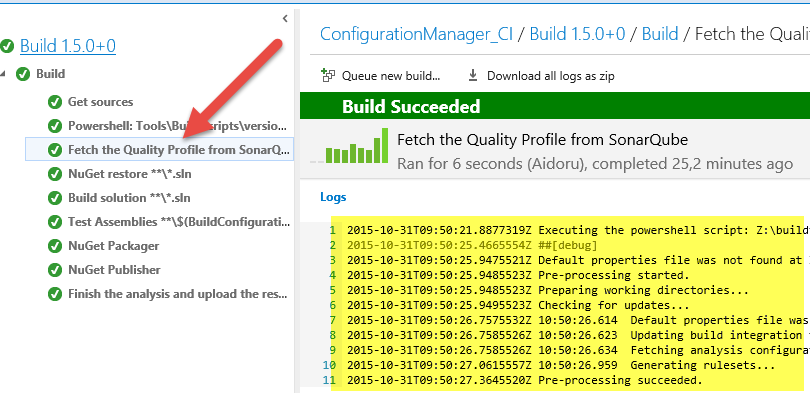
I can now schedule a build, and verify the output. First of all the output of the Begin Analysis task should connect correctly to the server and download the profile.

Figure 5: Output of the Start task for SonarQube Analysis
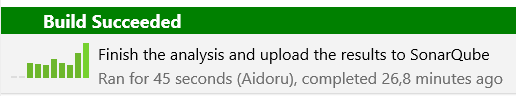
The output of the end step, should contains a really longer log, because it is when the Real Analysis is done on your code.

Figure 6: Analysis took 45 seconds to complete
It is important that the end analysis task is the last one, because sonar analyzer is capable of understanding code coverage result from your unit testing , a metric that is controversial, but gives you a nice idea on the amount of Unit Testing that the project contains.
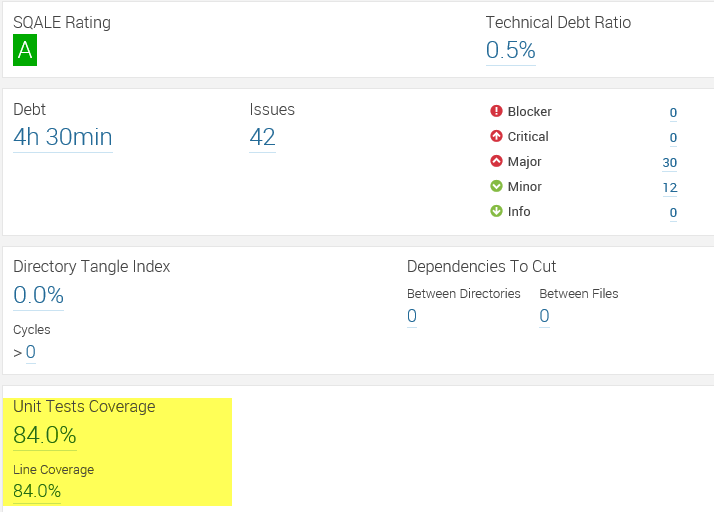
Figure 7: Code coverage result is correctly saved in Sonar Qube
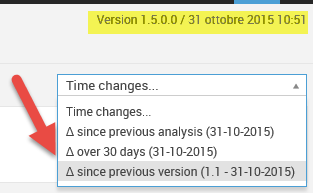
Thanks to automatic versioning, you have also a better timeline of the status of your project.

Figure 8: Versioning correctly stored inside Sonar Qube
The entire setup should not take you more than 30 minutes.
Gian Maria.