TFS Rest Api and Asof operator
TFS Rest Api are one of the most exiting new feature introduced in Visual Studio Online. One of the most important aspect of TFS is the ability to gather data about our team and having full access to that data for custom reporting is the primary need for most people. While you can query TFS Warehouse database for on-premise TFS to gather all the data you need, you have no access to databases for VSO In such scenario Rest APIs are the best way to interact to your account to quickly grab data to consume from your application.
To start experimenting with the API, one of the best approach is using some Rest Client (I use Advanced Rest Client for Chrome ), login to your VSO account so the browser is authenticated and start issuing requests. As an example, suppose you want to create a chart of Bugs Counts subdivided by State. Sadly enough Work Item query Language does not supports grouping functions, but with Rest APIs you can get data you need with multiple queries. One of the coolest REST endpoint is the one that allows you to execute a Query in Work Item Query Language.
You can POST to this url
| |
With a json payload of
| |
Do not forget to set Content-Type header to application/json, and you got a result similar to this one.
| |
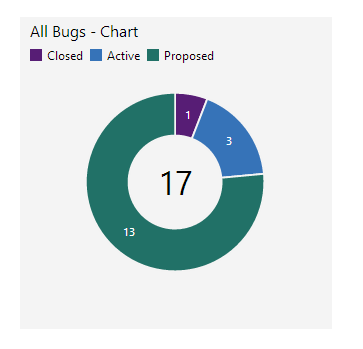
When you execute a query, the result is a series of Work Items Id, but if you need summary data for a chart, you can simply count the number of elements of the results array to obtain the number of bug in state proposed. In this example this number is 13. If You execute execute a separate query for each state you will end with all the data you need to create a simple chart of Bugs count divided by state. This is not a big result, because this type of graphs is available directly from your VSO account.
Figure 1: Count of Bugs grouped by state
But the most interesting aspect of using Work Item Query Language is the asOf operator. In the above result you can see that the result starts with
asOf: “2014-07-05T09:52:39.447Z”
This indicates that the results of the query was done at that specific instant of time, and the interesting part is that you can use the asOf operator to query WorkItem at different point in time. Es
| |
As you can see I’ve added asOf and a timestamp at the end of the query. This instruct TFS to execute the query and returns me the result valid at that specific Timestamp, in fact I have different number returned.
| |
Number of Bug in state “proposed” was 16 and not 13 at that different timestamp. If you issue multiple queries, you can also create a trend graph with easy.
Thanks to asOf operator and REST API, grabbing historical data from TFS to create custom charts or report could not be easier. My suggestion is creating a routine that grab the data you need and save in some local store. Run that routine each day to keep your local data aligned, then manipulate data with Excel PowerPivot or other similar tool to create the Charts you need.
Gian Maria.