Continuous deploy on Test and PreProduction server was always an argument that fascinates me a lot. The ability to have latest version of the code up and Running in a Test environment is a must for every developing team. I’ve wrote some articles in the past on how to obtain such result for Web Sites and TFS.
- Deploying on AzureWebSites from on-premise Team Foundation Server
- Deploy Asp Net web Sites on IIS from Team Foundation Server Build
- Manage Test Data in Visual Studio Database Project
- Continuous Deployment on Windows Azure Web Sites with Database Projects
- Build, Deploy, Web Performance test with TFS Build
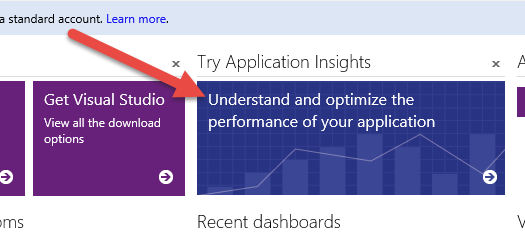
Now that you are able to automatically deploy a Web Site you need a way to monitor your site to verify what is happening during testing and beta phase. Thanks to Visual Studio Online Application Insights, you can have a lot of information about your application with very little effort. This kind of information are most useful for production server, but they can be really useful even during testing phase.

Figure 1: Application Insights in Visual Studio Online
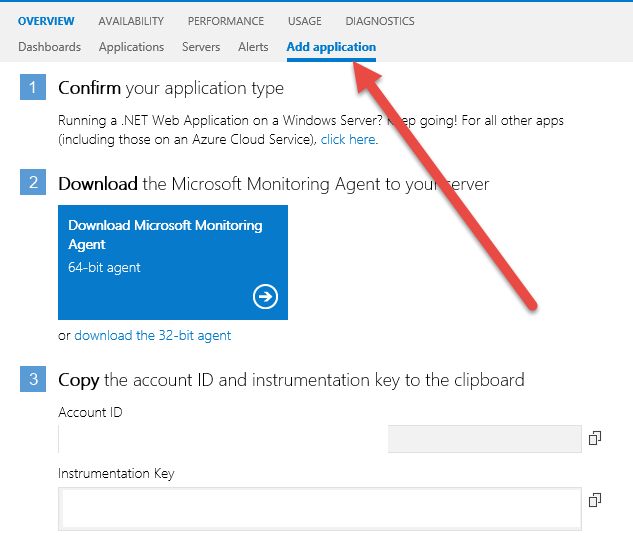
You can have various level of instrumentation, the simplest one is using what is called Unobtrusive Monitoring that give you data without the need of modifying your project. All you need to do is open the application hub and add a new application.

Figure 2: Adding a new application to Application Insights
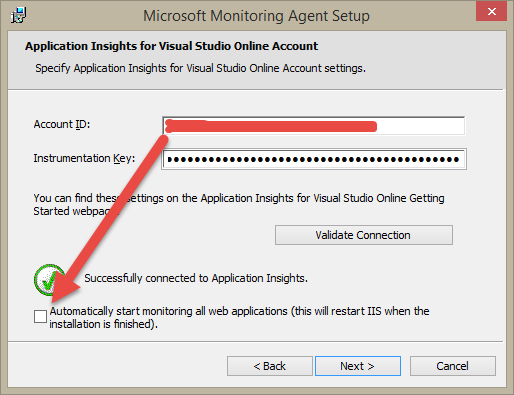
You should only download Microsoft Monitoring Agent and install on your machines where you deployed your Web Application. The only information that the installer asks you is account id and instrumentation key (these information are contained in VSO setting page). During the installation phase you can choose to instrument all of your applications that resides on local IIS, but I strongly suggest not to use that option and avoiding to start monitoring all applications. 
Figure 3: Avoid to automatically start monitoring all web applications.
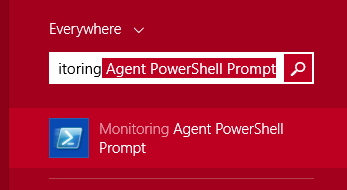
The reason behind this is: I prefer to control what application to monitor and also I want to give a friendly name to monitored applications , because once configured you cannot change the name. After Monitoring Agents are installed you can simply open Monitoring Agent PowerShell Promptto configure sites you want to monitor.

Figure 4: Open the MMA Powershell Prompt to manually configure monitoring for your applications
If you want to monitor a site called TailSpinToys and have several of them deployed in various Test Web Server, the ability to choose the name of the application is a key point. If you choose to automatically monitor all web applications of local IIS you will end with a single TailSpinToys application with multiple machine monitored. If you choose instead to manually start monitoring applications, you can configure the name of the application. Suppose you are on a machine called WebTest1, you can start monitoring TailspinToys application with this command.
| |
Display name is the parameter that permits me to distinguish between applications and constitute the identity of the application in Visual Studio Insight hub. When monitoring is started, you can navigate on the site to generate some data, wait for 5-10 minutes for the server to start analysis and you should be able to see you new application in the application hub.
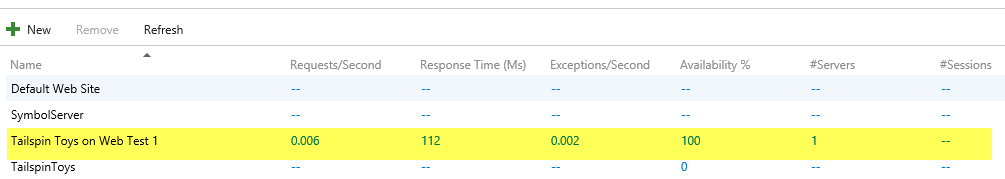
Figure 5: New application is now available in the list of monitored applications
The really good aspect of Application Insights is that you only installed an agent and configured applications with a simple PowerShell command and you start collecting data. The effort is really minimal. In future posts I’ll show you what kind of data you can expect from this type of unobtrusive validation.
Gian Maria.