One of the most interesting aspect of TFS is the great ability to give you all the statistics you need about your project thanks to the integration with SQL Analysis Services. The ability to do complex report based on TFS Cube is really exceptional, but it somewhat complicated for small teams , that needs much more simpler data.
The solution has always been loading the result of a certain query in Excel and then create some Excel Chart to have a visual representation of Query Result Data. This approach is really useful and simple, but people really need something that can be shared in a much more simpler way. Latest TF Service update and TFS 2013 RC introduces a * new functionality in the Web Access called LightWeight Charting that permits you to do simple charts from the web interface *.
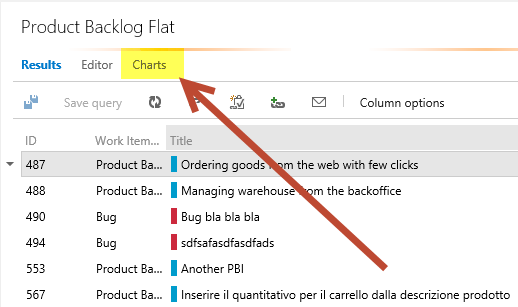
That feature is really visible, and you can access it from the web interface of a result of a query

Figure 1: Charts link in query result permits you to access new Charting functionality
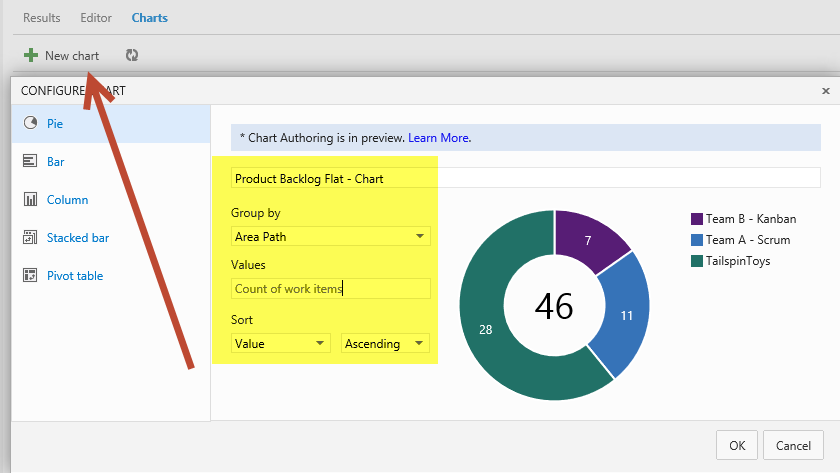
To create a new graph you can simply press the New Chart button in the Chart area, and simply choose the field you want to use for grouping and what you want for values, Ex, you want the count of Backlog Item subdivided by Area Path, to have an immediate visual clue of the length of the backlog of two different teams of a project.

Figure 2: Creating chart is really simple.
Once the Chart is created it is saved and it will be always visible in the chart part of the query. Actually it permits only to use the Count of Work Items as Values, but we expect in future release to being able to do other operations, as summing up values of certain columns.
Charts supports basic Pivot tables, Es: you can create a table to show you number of work item for each member group subdivided by Area Path.
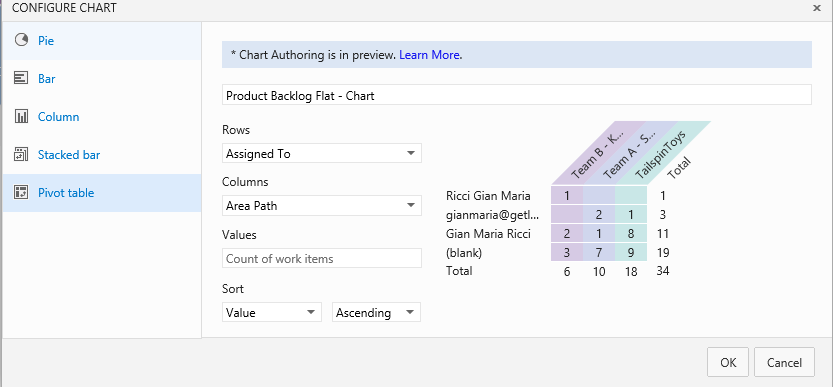
Figure 3: A simple pivot Table
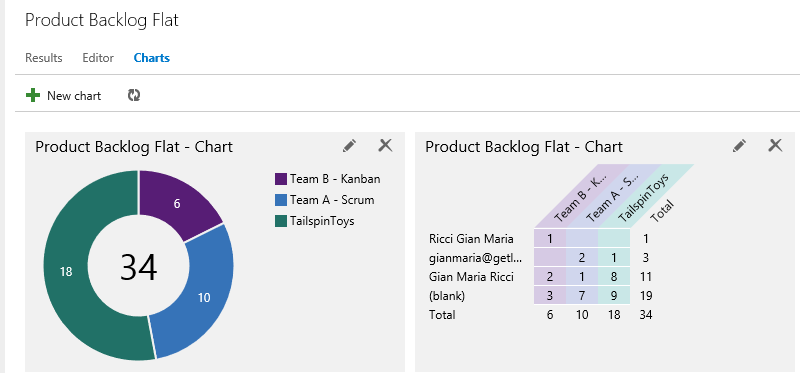
Once chart are saved they are always visible in the chart pane of the query, remember that actually you cannot create chart for Tree or Direct Link query types, and you can only use flat queries.

Figure 4: Saved chart will appear on the chart tab.
Remember that this feature is still at preview level, so you can expect more feature to come in future sprint releases.
Happy TF Service.
Gian Maria.