OpenXml Sdk is absolutely a fantastic library to programmatically create Office documents , but when it is time to add Chart components in Excel I‘m starting to feel the pain. I’ve searched in MSDN to find resource on “how to create a chart in Excel with OpenXmlSdk 2.5” and the only resource I’ve found is this article: How to: Insert a chart into a Spreadhseet document.
The article is good, but you immediately realize that the code is not so simple and that is not easy to understand how to modify it to suite your need. In my specific scenario I need a Pie Chart and I need also to create a chart that use data located in the same workbook of the Chart Itself. Moreover the customer want to choose the format of the graph, with all the 3D options available in Excel 2013. The result is that the aforementioned example in MSDN is quite useless.
After some tentative, I understood that even changing the type of chart is not a trivial stuff, so I wrote in MS Forum to get an answer. The answer pointed me in the right direction, I was not aware a cool feature of a tool called Productivity Tool for Microsoft Office, that permits you to open an office file, navigate between the various parts that compose the document, and being able to reflect the code of the Sdk needed to create that part of the document. It is the Reflector of Office document.
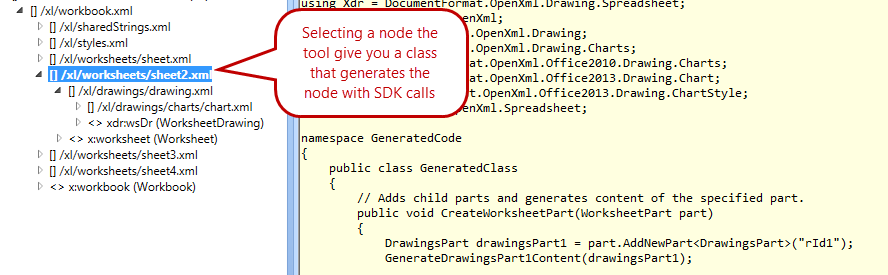
Apart of being really useful to understand how the SDK works, it can be used to generate the code for you. I’ve started filling a Sheet with some test data, create a chart on it and formatted until the customer told me that it is good. Opening that file in the Productivity tools and selecting that sheet gives you a class that contains the complete code to regenerate that specific sheet. Since the chart grab the data from selected cell range, you can simply use that code to recreate the test sheet, and then change the content of the cells to reflect the data you want to show.

Figure 1: The ability to Reflect Code creates a class that generates selected part.
If you inspect generated code, it contains a CreateWorksheetPart method that accepts a WorksheetPart and fill it to make it identical to my test file. Once imported in your project you should do little modification to the code to suite your need. Since I need to generate multiple sheets, each one with a specific name, I need to change the CreateWorksheetPart method to accepts the name of the worksheet.
| |
Then locate into the code all the code lines where the original name of the worksheet is used and change it with the real name of the worksheet. This is an example of the type of code you can find.
| |
You should have the original name referenced in more than a single part, be sure to inspect all the code to find all references. I suggest you to use a very distinct name as the sheet name in the original Example file used to generate the code. Now I can simply use that class to generate the sheet for me.
| |
I have some data to display, for each series of numbers I create a Worksheet using a simple helper function called AddWorksheet I’ve found in this interesting article on CodeProject: Creating Basic Excel workbook with Open Xml. After these 4 lines of code I simply proceed to put data in the range of cells used to feed the chart and everything should works correctly.
I was disappointed because generated excel file is not valid and even recovering it gave me a series of sheets with only the data and no charts. It turns out that generated code does not save created chart objects, but this can be easily solved adding a few lines in the end of the CreateWorksheetPart.
| |
The overall process is really quick.
- Create an excel with a sheet that contains some test data and a chart formatted as you like
- Save that file and open in the SDK Productivity tool
- Copy all the code related to the sheet and import into your project (change the name of the class to have more meaningful names)
- Add the save instructions to save generated object
- Modify the range reference to include the real name of the workbook (if you want to be able to change the name at runtime or you need to create multiple sheet)
And you are ok.
Gian Maria.