If you use the Agile process template, you have three columns related to planning and tracking task duration, they are called:
- Original Estimate
- Completed Work
- Remaining Work
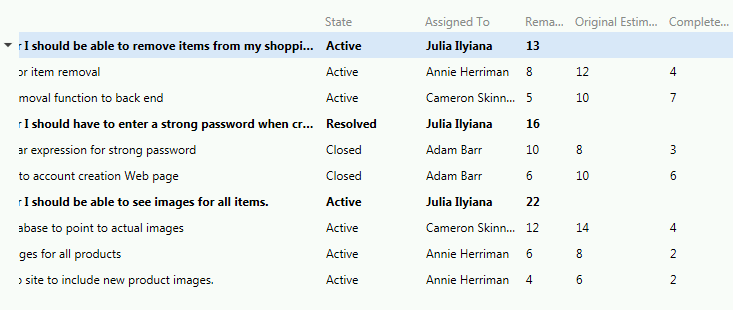
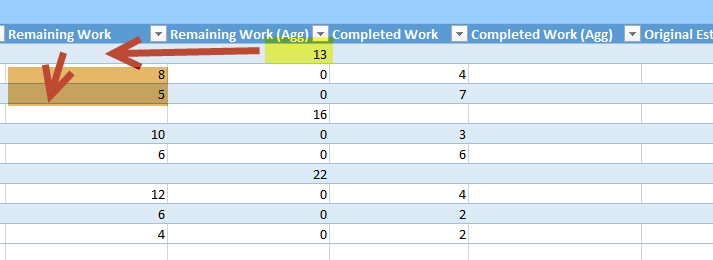
The only problem is that TFS only aggregates the Remaining Work in the agile boards , as you can see in Figure 1 :

Figure 1: Board with Original Estimate and Completed Work columns visible
There is a Server Side plugin called TFS Aggregator available in Codeplex that can mitigate this issue, but using a Server Side plugin could not be the optimal solution. If you are using TF Service on Azure you have no option to install any server side plugin or any customization of process template , but even for on-premise installation, installing a server side plugin can complicate your maintenance of the server and you should trust the author of the plugin for keeping it update as new versions of TFS will be released.
A possible solution is using TFS API to load all data in a custom program and then doing calculation directly with custom code , but this can be an expensive solution in terms of time.
The third solution is using excel to do the calculation for you. If you load data from TFS and choose to add the three aforementioned columns, you can start adding another column after each of the three as shown in this picture.

Figure 2: Three empty columns added to the Excel worksheet connected to TFS
Now we need to create some formula to aggregate data of all task into parent User Story. In such a situation the simplest approach is creating a custom excel macro, es:
| |
This is a super simple macro, it accepts a Range and it does the following operations
- If the first cell of the range is not empty it returns 0
- if the first cell is empty it starts to cycle all the cells below the first cell
- for each cell that is not empty it sum the number to a running total
- the cycle will stop when the first empty cell below the first one is encountered
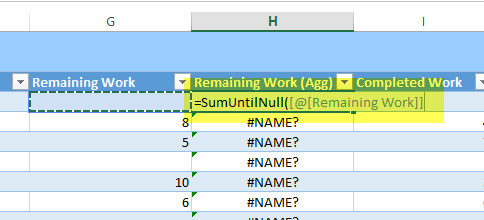
Once you have defined such a function you can use in your new columns, the interesting part is that you can simply start typing your formula (=SumUntilNull), then you click the Remaining Work column of the cell in the left, and Excel automatically understand the field you are using, as you can see in Figure 2.

Figure 2: Use your function to create the aggregation
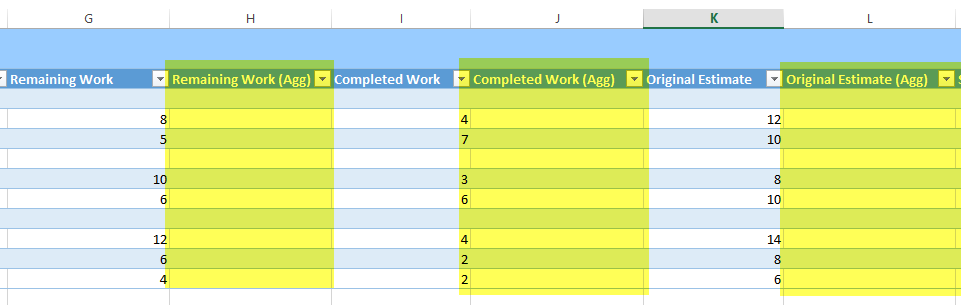
Once you finish the formula, Excel will replicate the formula to all the rows of the area connected to TFS. The trick is: for each row where a User Story (the father item) is present, the value of the cell is null, so your function automatically iterates on all related task until it find another null cell (end of the interval or the next User Story). This will aggregate the data for you.

Figure 3: Your formula correctly aggregates all the value from child work items (Task) to the parent (User Story)
the advantage of this approach is that you can simply press “refresh” in the TEAM tab, and Excel will update all work items from Team foundation Server, new Task will be loaded and your totals will updates automatically without any further modification.
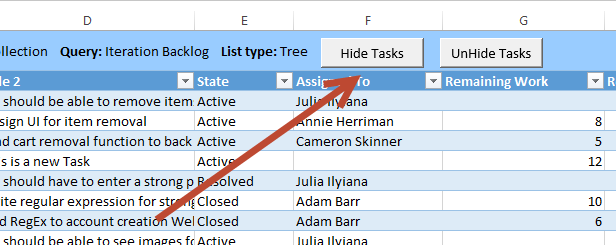
Thanks to excel macro, manipulating the result of a TFS Query is a really simple operation. If you are not interested in the Task part of the query, but you want only to visualize the User Story and the aggregate value, you can also use another simple macro that hides all Task rows whenever a cell in the Worksheet change.
| |
The above macro iterate in the first 100 rows of the sheet (it should be placed inside the sheet where you loaded the Work Items) and change the visibility of the row, hiding all Task Rows. A better solution is adding a couple of buttons to hide/show tasks , instead of having it run for each change in the Worksheet :), but it is only to give you an idea of what you can achieve with excel.
Figure 3: A couple of hide / Unhide buttons to simply hide / unhide all tasks rows
Manipulating data with Excel is really interesting, because it does not require so many technical skill, it can be easily done even by managers and does not require a developer. Once the macro is in place, it is just a matter of opening the excel, choose to refresh the data from TFS and the game is done.
You can download an Excel connected to the Brian Keller Virtual machine with all the macro at this address http://sdrv.ms/16lxfxJ
Gian Maria