A common question about TFS 2012 build is: how can I ask for code coverage?
The answer is really simple, you should go to the test section of build definition and change the run settings from Default to another setting that includes code coverage and this is really everything you need to do.
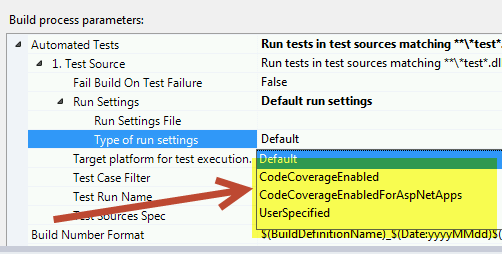
Figure 1: Change run settings to enable code coverage
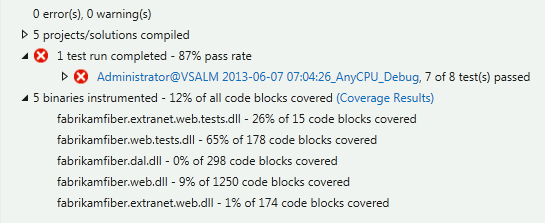
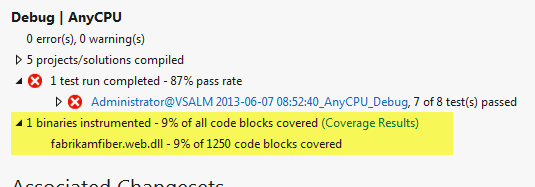
Now launch the build and verify that you have your binaries instrumented and Code Coverage correctly computed.

Usually this lead to another question: Can I decide which assembly to include in code coverage instead of having all of them instrumented?
The solution to this answer is creating a customized test run setting file , the only drawback is that you have no template inside Visual Studio and no editor (as you had in VS 2010 with TestSettings files). The good news is that you can simply add an xml file inside your solution, give to it the extension.runsettings and copy inside it this simple fragment of configuration.
| |
You have lots of options, but in this example I’m interested only in limiting the number of assemblies that will be instrumented for Code Coverage. This can be done simply specifying one or more regular expression in the ModulePaths section. You can use Include to define regex for inclusion, or you can use exclude to specify which assemblies will be excluded.
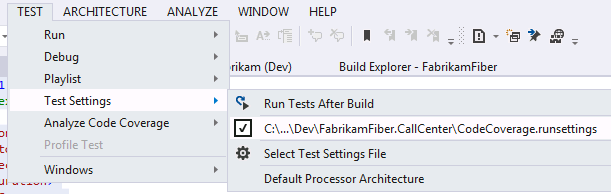
Once you authored this file, you should use it as active test setting configuration to test if everything is good , and verify that after running all of your test locally, Code Coverage result is what you expected. Remember that once you’ve have this run settings activated, it will be used for all of your local test run.
![image_thumb[2]](https://www.codewrecks.com/blog/wp-content/uploads/2013/06/image_thumb2_thumb1.png)
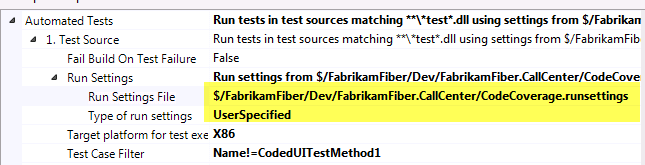
Once everything is ok you need to store this file in source control, check-in and modify Build configuration to use this customized file as a Run Settings File for the build and the game is done.
![image_thumb[5]](https://www.codewrecks.com/blog/wp-content/uploads/2013/06/image_thumb5_thumb1.png)
Now fire the build again, this time only selected assemblies will be used for code coverage.
![image_thumb[8]](https://www.codewrecks.com/blog/wp-content/uploads/2013/06/image_thumb8_thumb.png)
MSDN Link to test run setting file: Customizing Code Coverage Analysis
Gian Maria.