Setting up Remote Debugging is usually a simple task, you can read the Set Up Remote Debugging guide on MSDN and you are ready to go, but sometimes it does not work and you are not able to connect to the remote process; in this post I want to give you some suggestions to troubleshoot the most common problem that you can encounter.
- First: you need to be aware that Remote Debugging Managed Code is only available when you use the authenticated mode, if you run the remote debugger without authentication you can debug only Native Code , but the main problem is that usually the host and remote machine * are not in the same Domain. To bypass this situation you need to create what is called “Shadow Account”, this means that you need to have in * both machines the same user with the same password. *
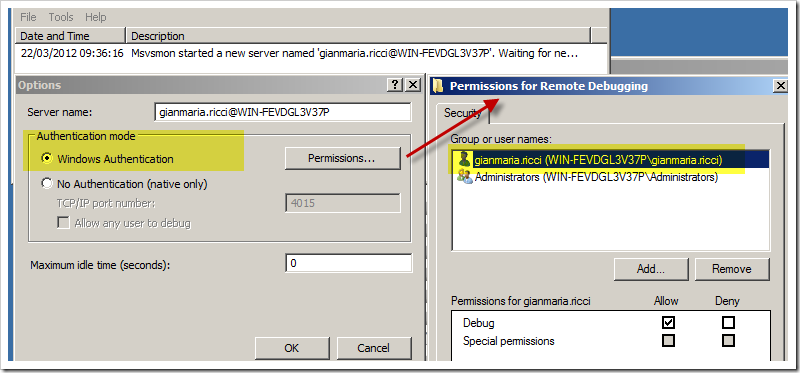
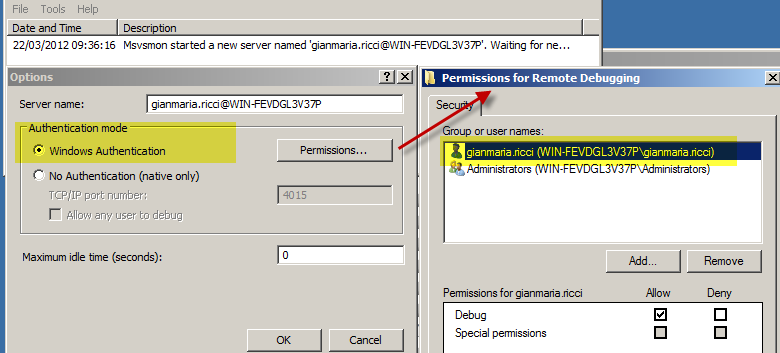
Figure 1: How to setup authentication if you do not have a domain
As you can see in Figure 1 , I logged in the remote machine with the same user I’m logged in the host machine (the machine where I’m running Visual Studio), then I launch the remote debugger and configure to use Windows Authentication, you should also verify that current user has the Debug permission. As you can see from the description of the remote debugger is now operative and tells me: Msvsmon started a new server named gianmaria.ricci@WIN-FEVDGL2V37P. The part username@machinename is the name of the server.
Second: *You need to be sure that the appropriate firewall ports are open in both machines, you can verify ports used if you launch the configuration of Remote Debugger, that tells you to open DCOM port (TCP 135) and IPSEC (UDP 4500 / UDP 500) if you run under IPSEC. If you still have problem to connect, you can try to disable the firewall on both machines, try to connect again, ad if it still does not work you probably have some authentication problem, so refer to first step and verify that you are logged in the remote machine with the same user you are using in the host machine. If you are able to connect with firewall disabled, turn on one debugger at a time (host and remote) and verify which is the one that is blocking the connection.
Third: *please be sure that in the Attach to Process dialog you are using * Default Transport *and the qualifier in the form username@machinename, because this is required to do an authenticated connection. Finally, if you are able to see the list of remote processes and attach to them but your breakpoints in code are not hityou should check the type of code you are debugging, pressing SelectButton in the Attach To Windows and choose the right type of code that is used by the remote process, as seen in Figure 2.
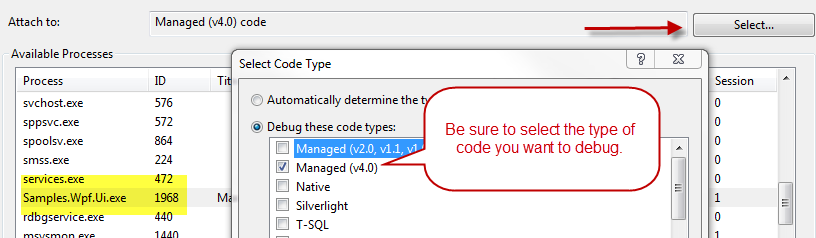
Figure 2: Choose the right type of Code Type that is running in the remote process
Please verify also you have opened in Visual Studio the same code that is running in the remote machine and that Pdb files are correctand also that you are compiling in Debug Mode and generation of Pdb files is enabled in the Visual Studio. (You can even debug a program in release mode, but you need to be sure that you are generating Pdb files in release mode).
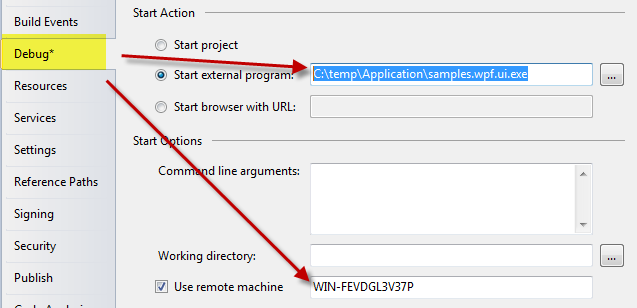
If everything went good and you are able to attach to a remote process, you can also configure Visual Studio to automatically run the program in the remote computer as shown in Figure 3. In this scenario usually you can setup a shared folder in the remote machine and configure a post build action that automatically copies the result of the build in the remote machine through the shared folder. The important fact is that the Start External Program should point to a valid executable in the remote machine and the user should be logged in the remote machine with Remote Debugger opened and working.
Figure 3: Configure Visual Studio to start and debug a process in the remote machine
Everything should work, when you press F5 the program should start in the remote machine and you have the debugger attached to it.
Gian Maria.