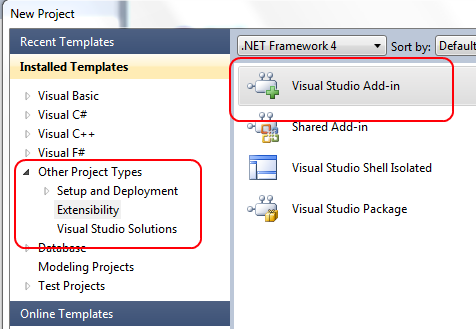
Code Downloadable Here . Visual Studio is really a complex and big product, but it is amazing to see how simple it is to write an addin to extend its functionality. First of all we have a dedicated project type for writing an add-in from inside Visual Studio (dogfooding)
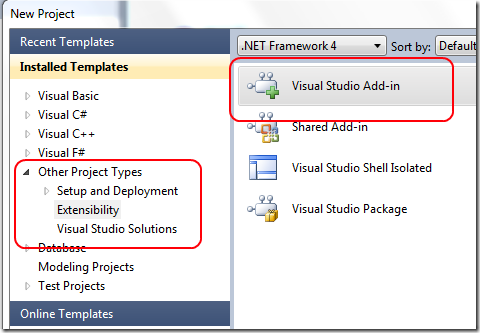
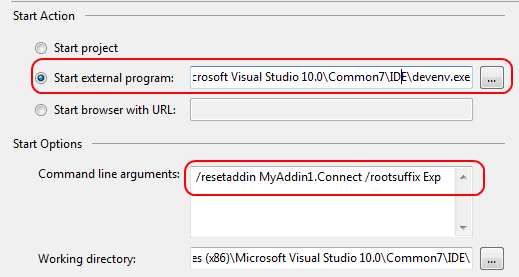
Choosing the Visual Studio Add-in a Wizard helps you to decide the type of the addin.The wizard asks for the language to use, and some information, like if the addin should be loaded at startup and if it must be listed under the tools menu. After you created the project you can go to project properties and verify that, in the debug pane, the project is setup to start devenv.exe as start External Program
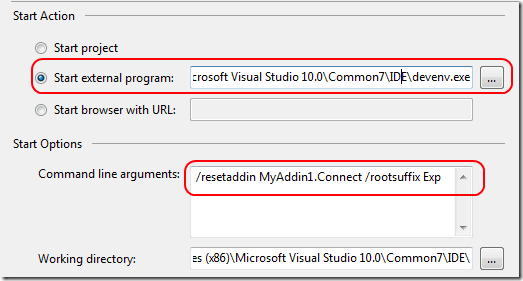
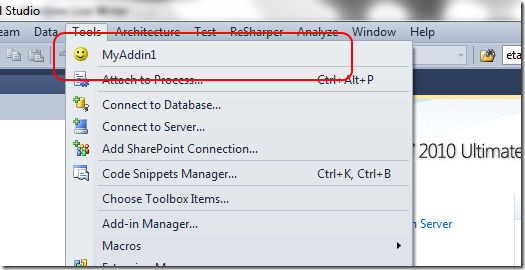
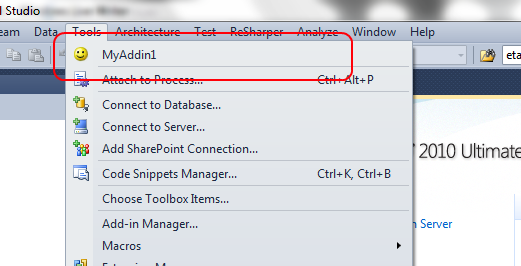
The default arguments are the /resetaddin MyAddin1.Connect , but I also added the /rootsuffix Exp to start with the Experimental Registry Hive. This is needed to prevent that the addin you are developing will mess with normal settings of Visual Studio. Now you can simply press F5 and you should see another instance of Visual Studio that will opens up, and your new command should be listed in the tools menu. No modification is made to the standard Visual Studio settings, so you are sure that you cannot damage VS during development of your addin.
The good point is that you obtained this without a single line of code and with no effort. Now I want to execute some code just to understand how to interact with the VS IDE.
I want to develop an addin that simply iterate through all solution projects and files and dump all names to the output console.
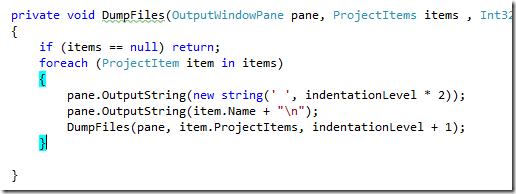
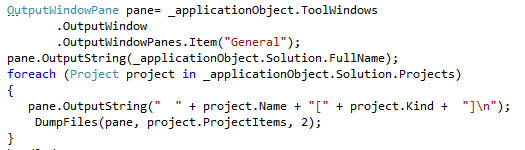
The code for doing this is really simple, you need to locate the connect.cs class, and write code inside the Exec method.
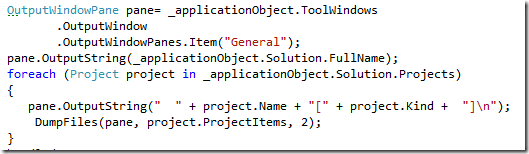
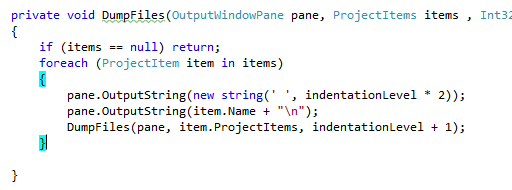
As you can see it is really simple to interact with VS IDE; thanks to _applicationObject I can interact with the solution and enumerate projects, but I can also obtain a reference to the General pane of the output windows, to write string to the output console. Now I can simply dump solution name, then iterate into all the projects dumping project name and project Items. The DumpFiles method is a really simple recursive method to iterate into all project contents.
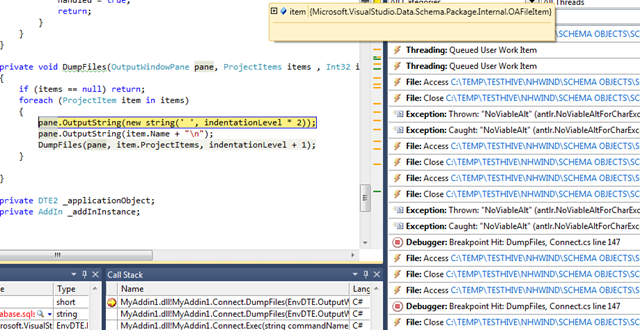
The really amazing stuff is that you can setup a breakpoint in code, press F5, go to the newly opened Visual Studio instance (Experimental Hive), load a solution, invoke your command and theh breakpoint will be hit in the original instance of VS :) you are debugging Visual Studio with the Visual Studio debugger, with all the features enabled, like for example Intellitrace or pinning variable values to the windows, or doing whatever you can do in a standard debugging session.
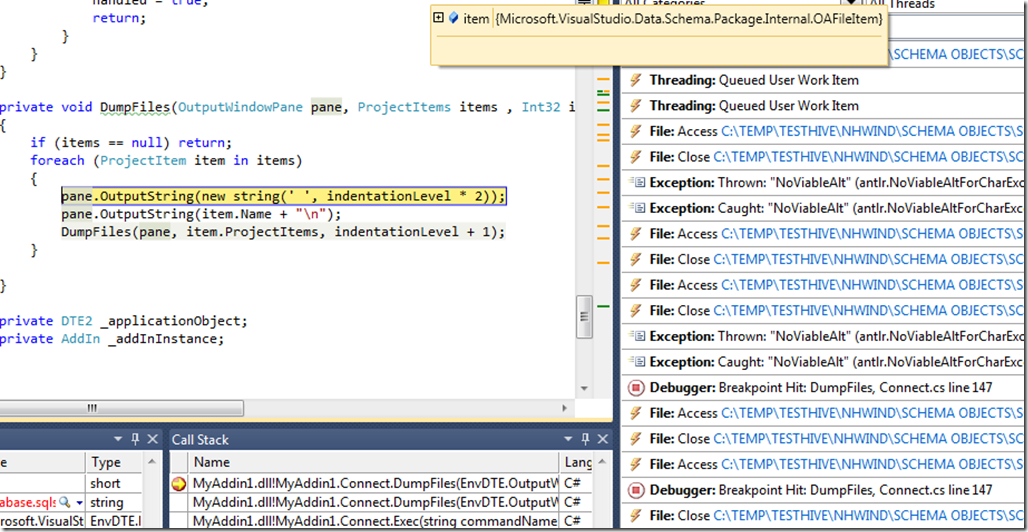
The ability to use intellitrace is AMAZING because it helps you a lot to understand what is happening and what is happened inside VS. In the above screenshot I put a breakpoint into the function that output file name and traverse project tree, then I continue my debug session pressing F5 or F10, but with intellitrace I can simply look at variable values for each execution of the recursive iteration, as well as looking at events. In that example I can see that visual studio is actually accessing physical solution files :) but I can move in the past to understand the values of the Item object in each interation.
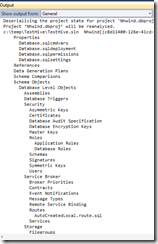
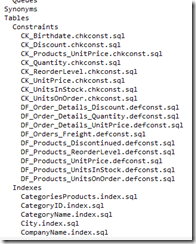
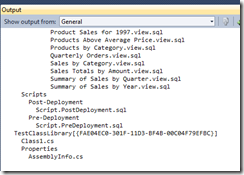
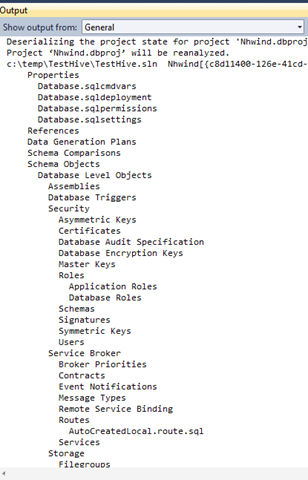
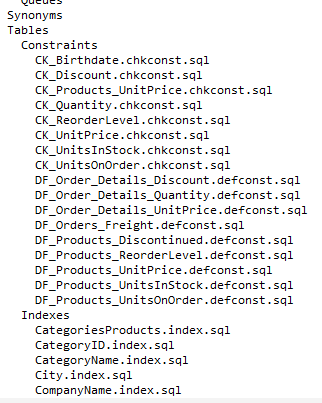
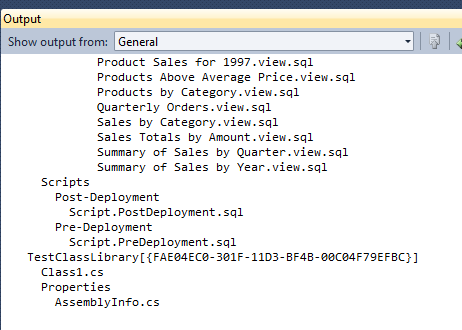
When the function finishes to execute I can verify in the debugged VS that the addin really did what I’m expecting, so i take a look to the output windows in the General pane. In this example I’m dumping the content of a Database Project where I imported the Northwind structure and a simple empty C# project.
As you can see, with very few lines of code you are able to write an addin that explores solutions files, and with a fantastic Debugging Experience.
Code Downloadable Here . Alk.