Optimization of Javascript and css files
The first page of a web application is the first thing that users look at, and it is very important that it performs well. In old post I dealt with some tools to analyze application performances, today I want to spent some time to deal with one of the most common problems of web applications, too many css or javascript file to download. I take an application I’m working into and did some check on the page that gets showed after a login, I first start with VRTA.
To use VRTA with a single machine I use a couple of tricks. The first one is using a virtual machine with VMWare to run VRTA and intercept the traffic to IIS in the host machine.The second trick is using fiddler to limit the bandwidth between the host and the virtual machine. To have real data you should use VRTA with a bandwidth that is similar to the real situation. To be pessimistic I use fiddler to “simulate modem speed”, that is a 56k.
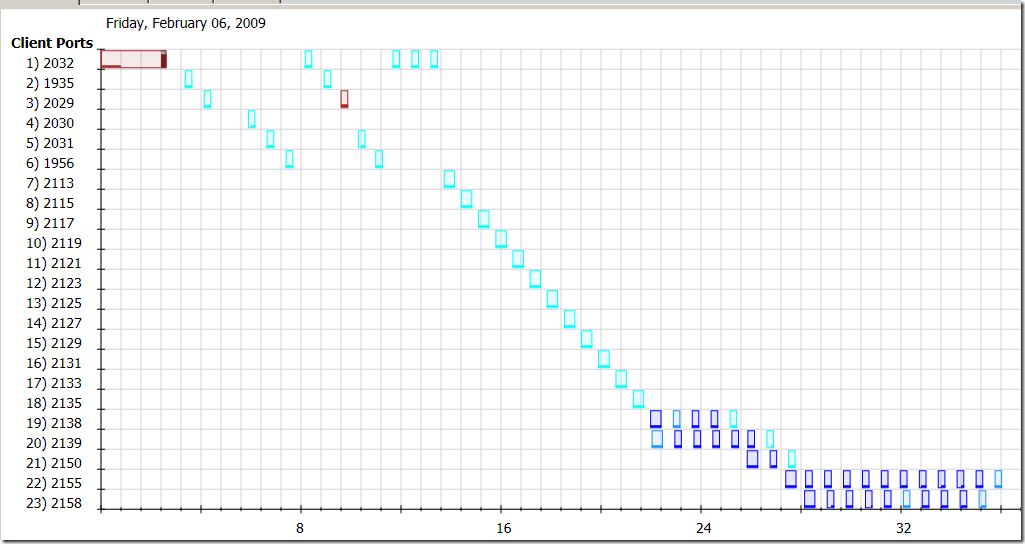
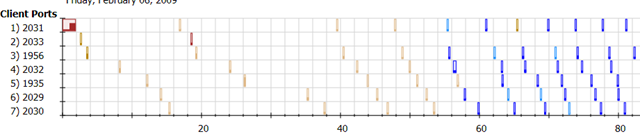
I fired VRTA, clear browser cache and reload the page, the result was an astonishing time of 122 seconds to load the first page. This result shows that the page is really inefficient. If you inspect the result of VRTA you can see this kind of pattern

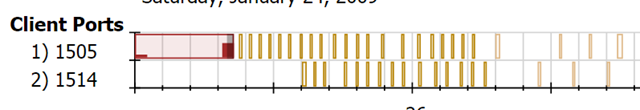
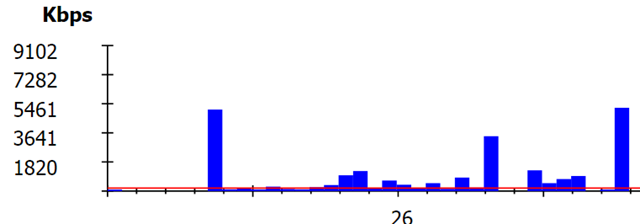
The client uses only two ports, but the problem is the request of a too much css files. Each of the brown little rectangle are css files, and white spaces between them is time wasted to do requests. If you look at the total download speed
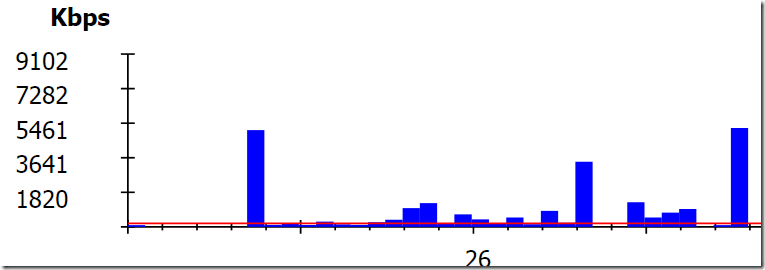
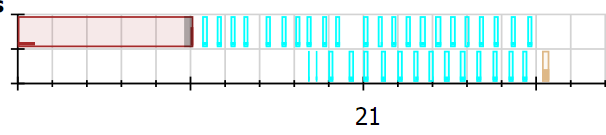
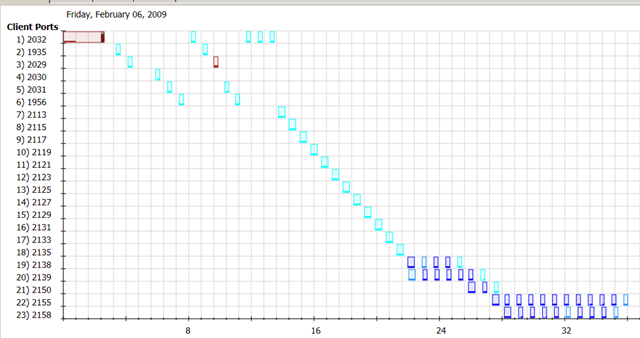
The average speed was 31 Kbps and since the peak bandwidth is 9102 kbps VRTA calculate a Bandwidth efficienty rate of 0.38%. Now you should ask again for the page, this time the browser have the various file in cache. If you think that with css and images in cache the situation will be better you are really wrong, it is true that you download less bytes but you still need to do a lot of web request just to see that everything is in cache.
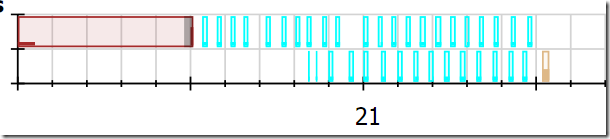
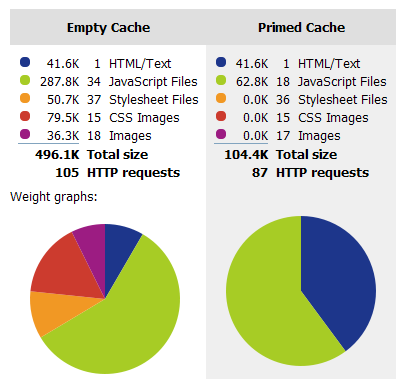
The cyan rectangle are telling you that data for css are is in the cache, but the total time to render the page is quite the same, because the browser waste time asking for tons of file just to receive a response that those files are in cache.About 20 seconds only to verify that css are in cache…ouch. If you check the page with YSlow you can see some interesting data.
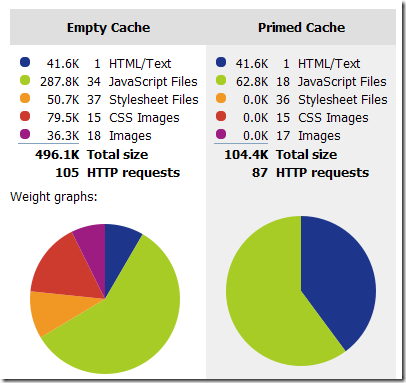
Too much requests for a landing page, 105 http request. The solution is to use some tools that reduce requests. Two candidates are css files because I have a 50k and 37 request the first time, and some javascript files, because they are 287k (the bigger size of the page) in size for 34 requests. A viable solution is using the YUICompressor. I’ll show you how to configure YIUCompressor in a subsequent post, now I want only to show the result.
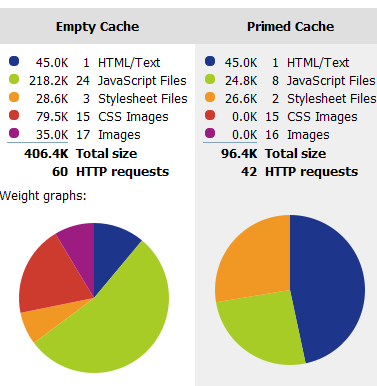
The YIUCompressor is capable of automerge css and javascript file during deploy operation, with little changes in the project (1 hour of work) I changed css and javascript file organization to obtain this result.
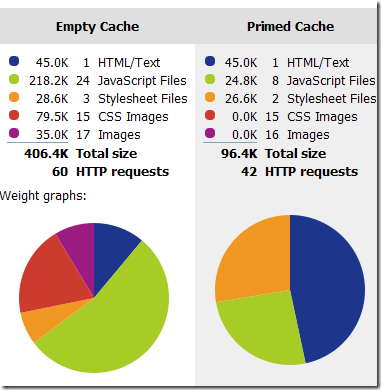
If you compare the result you can find that css files size is now 28k, and I have only 3 request against original 37 requests. For javascript files the reduction is smaller, this because most of the js files are generated from microsoft ajax to access webservice layer. I drop from 34 request to 24 request for js files, now it is time to fire the VRTA.

Despite from the fact that now it uses more ports, total time is dropped from 122 to 80 seconds with a simulated modem speed, it is still far from optimal, but is much more better. If I reload page, now I can use the cache, and the result is really good
With cache enabled now the page respond in only 38 seconds, this is because I have less web request to do.
All these analysis are done with debug=“true” in web.config and the site and all modules are compiled in debug mode. The next step is to test everything in release mode to really check the site in “Real deployed scenario”.
alk.
Tags: asp.net YUICOmpressor Optimization