SonarCloud is free for Open Source projects, and for languages like Python, that does not need compilation, it can directly analyze the repository without any intervention from the author. This feature is automatically enabled when you setup your Project in SonarCloud and it determines that you have not compiled language.
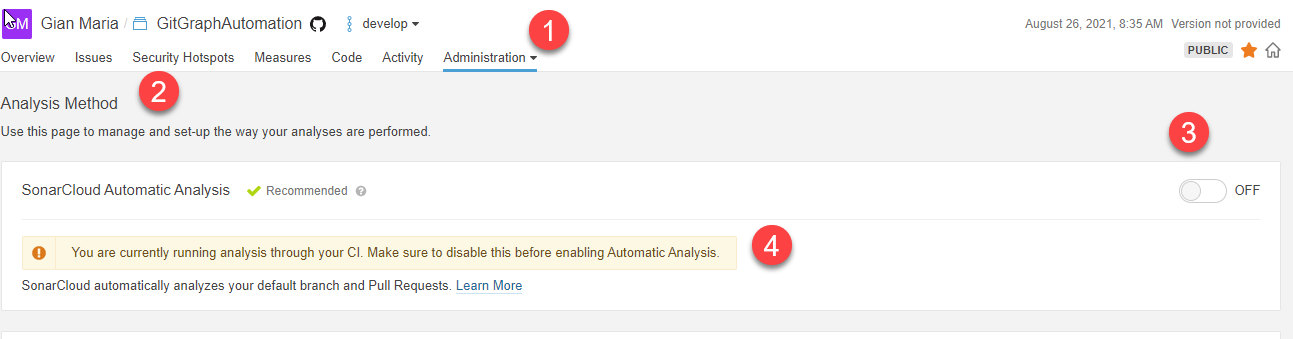
Figure 1: Analysis configuration shows that in this project we have CI analysis
If you look at Figure you can see that in my situation I have a Continuous Integration based analysis and my automatic analysis is disabled. The reason for this is that even if Python is not a compiled language, I have other data, like code coverage, that I’d like to include in SonarCloud report. Code coverage is one of the data that should performed with Continuous Integration.
SonarCloud is a Must To Have tool in your Open Source project
Luckily enough GitHub Actions can perform this task with a really simple workflow. You can follow the guide at SonarCloud to setup all the basic for your workflow. A working example is found in one of my project https://github.com/alkampfergit/GitGraphAutomation/blob/main/.github/workflows/pylint.yml. It starts with some prerequisites
| |
Installing python is a dedicated GitHub action task, but then you can simply run a script to upgrade pip and install everything you need, in this situation all packages needed to run test with pytest and code coverage.
Running the test is another one line run task, just run pytest as you would run inside your environment. The only peculiarity is using –cov-report option to choose two distinct report methods, xml and html. I strongly suggest you running this command in your environment to verify where it will generate output files.
| |
Once test with code coverage run, it is time to upload HTML report as artifact, this will allow people to download the full report for offline analysis. It will only need the directory to upload as artifacs, and, upon local testing, you can verify that pytest will create a nice folder called htmlcov that contains all the report.
| |
This is one of the main limitation of GitHub actions if you compare with Azure DevOps pipeline, you do not have a dedicated section in output report for testing and code coverage, but you can only upload results to Action Result to be viewed offline.
GitHub Actions still lack some features compared to Azure DevOps pipeline, as an example, a test summary is really needed
All you can see in GitHub Action result detail page is a box that allows you to download the report, but you have no way to have a quick look at how many tests ran and code coverage.
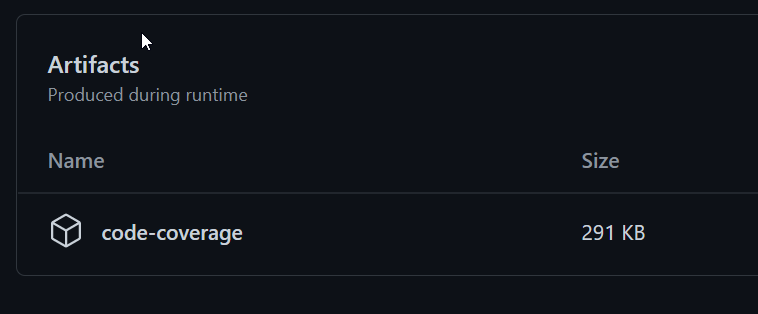
Figure 2: GitHub action result detail allows you to download all uploaded artifacts
But thanks to SonarCloud we can simply upload Code Coverage results directly to SonarCloud and then use all of the nice features like differential branches analysis and code browsing directly from SonarCloud. To enable code coverage I simply have this super simple sonar-project.properties file at the root of my repository. It contains key and organization (as for the guide) and then some specific properties to specify that I want to analyze only code that is under the src folder, that the code coverage is written in a cobertura format and that reports are in form of file that contains coverage in the name and ends with xml.. Please not also that I have specified that I have an output of tests in xunit format in a file called xunit-result.xml, this will add a count and a report of the test run to SonarCloud.
| |
Now everything is ready, we just need to add a task in GitHub action to execute SonarCloud analysis. This task will not need any complex configuration, it needs only token by GitHub and your SONAR_TOKEN secret (as for official guide). Everything else is configured in sonar-project.properties so you can separate SonarCloud configuration from the way you want to run (GitHub, Azure DevOps pipeline, CircleCi, …).
| |
After this small journey, just launch the action and verify that the analysis is correctly uploaded in SonarCloud as for Figure 3.
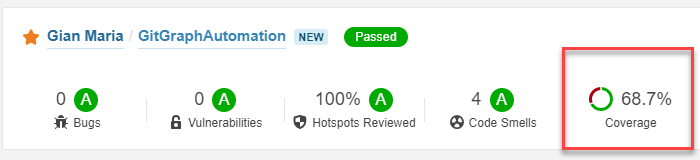
Figure 3: Sonar cloud summary of the project now shows code coverage
Once you enable Test support for SonarCloud, you can overcome the limitation of GitHub Action
Now you can use interface of SonarCloud to browse the result of your code coverage, as well as having trends and differential analysis.
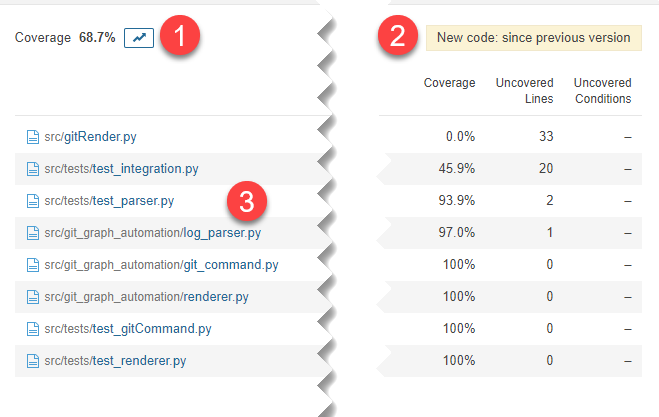 Figure 4: Code coverage detail in SonarCloud
But the real killer feature is the summary you have in project detail.
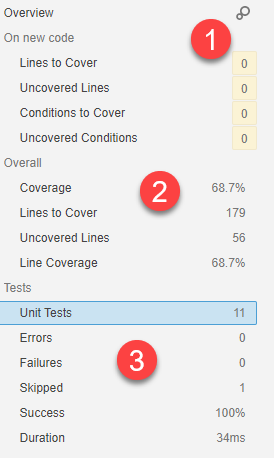
Figure 5: Test summary in SonarCloud
Test summary in SonarCloud gives you a tremendous amount of information.
In section (1) it gives you what change in the new code, in this example I’ve closed a branch where I did not write any new code, just change the readme so it is telling me that no new lines to cover was introduced. This is a real killer metrics, instead of aim to 100% code coverage, we can aim to not introduce too much uncovered code.
In section (2) we have a summary for Code coverage, and in section (3) I can have a summary for test run, this overcomes the limitation I have in using GitHub Action respect to Azure DevOps pipeline, missing a test summary. Who need a test summary in your Continuous Integration tool if you can look at everything in SonarCloud?.
I think that SonarCloud is a Must To Have tool for your open source projects, it is free, easy to use, and you can integrate advanced analysis (like code coverage) with a small customization effort.
As a final touch you can add a badge into your reamde file so everyone can check the quality of your code. Format of the url is really simple, it is something like this https://sonarcloud.io/api/project_badges/measure?project=alkampfergit_GitGraphAutomation&metric=alert_status where you should change the name of the project with your project name.
Gian Maria.