GitGraph is a nice library to create a graphic representation of Git log and the really nice aspect is that it is widely used and produces picture that are easily recognized as Git History. It can basically work in many ways, but the easiest is importing commit as json in an HTML page.
Thanks to very few lines of Python code I realized a simple POC that is able to use git log to extract log as json then create an html page with extracted json that renders a simple png with the full history. You can find the project in Github and it is really simple to use (just read the readme).
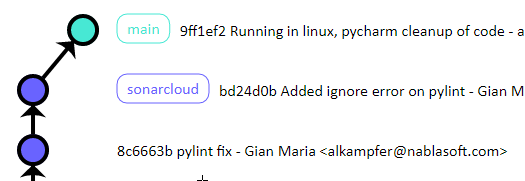
Figure 1: Rendered sample image
Feel free to open issues and Pull Requests :).
Gian Maria.