When developing a code library, it is good practice to publish it on a package manager like NuGet. A common objection to this approach is that using a library published as a package can make it difficult to debug the original code. However, this is not a significant issue as it encourages you to write unit tests within the same project in which you develop your library, ensuring that the library is well-tested and free of regressions. Nevertheless, there are times when it is convenient to debug the source code of the library while using in a real project. This is true especially for complex libraries where it is difficult to create unit tests that covers all options.
One of the most popular solutions to this issue is to use a symbol server to index your library, allowing you to always retrieve the correct version of the code used to compile the exact version of the DLL you are using. Azure DevOps is perfectly suited for this purpose, as it offers both a symbol server and all the necessary tools for automating the process of code indexing in a pipeline. This streamlines the entire process and ensures seamless debugging and development.
To have it working properly, you may need to modify your project file by adding the debug type option and setting debug symbols to true. This is necessary to use Azure DevOps symbol server without any problems.
| |
Once you have this modification in place, it is just a matter of using the .NET command-line compiler to create a NuGet package and then index the source code. The indexing part is where you create a modified version of .pdb files and stores them in your Azure DevOps account; it is just a matter of using a predefined task in an Azure DevOps pipeline.
Indexing your sources in Azure DevOps symbol server is just a matter of adding a task to the pipeline but gives you Super Powers to debug your libraries.
I usually suggests to create a Visual Studio project that targets both the .NET Standard and the full framework. This is not strictly necessary but helps me have the NuGet package contain both DLLs compiled for the full framework and at the same time for .NET core.
If your code is in Azure DevOps, both your package and the symbols, as well as the source code, are protected and accessible only to individuals who have an account and valid permission to access those repositories and nuget feeds. This is particularly important for enterprises or companies that are not publishing their code as open source. You can keep your code secret, distribute your DLL via a private package source feed, and only those who have access to the original source code repository can debug the source code. Programmers with that can only access NuGet feed can only use the DLL without being able to see the original source code.
This is the only yaml you need to add to your Azure DevOps pipeline that compile and publish Nuget Package.
| |
The PublishSymbols task is sufficient to search for all the Program Database files resulting from the compilation and index them inside the Azure DevOps account. You don’t need to do anything else, just publish the NuGet packages as usual into a nuget feed, and you will be able to debug the source code automatically.
Now you need to configure your Visual Studio (Figure 1), in the the debugging options, symbol subsection where you can add as many dev.azure.com accounts as you want, and each account will be used to download the Program Database file and search for symbols.
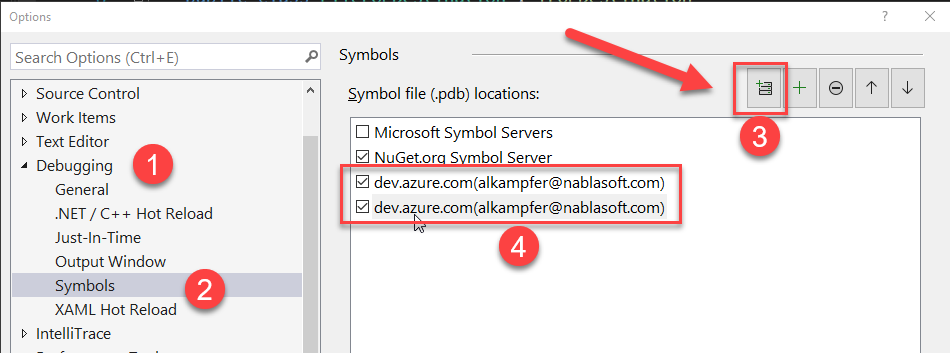
Figure 1: Configure Visual Studio to load symbols from Azure DevOps server
Another important configuration in the debugging section is the option to load symbols only for specified modules. This option reduces the load time of your program, as Visual Studio will try to load symbols only for assemblies with a specific path, as shown in the following picture. (Figure 2)
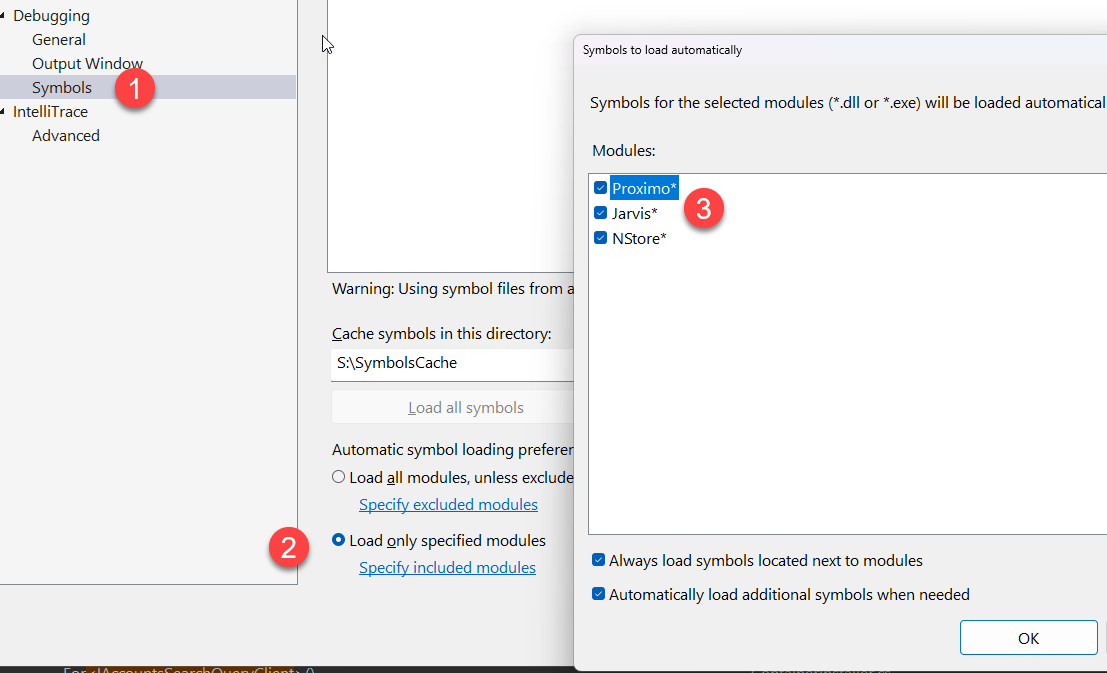
Figure 2: Limit the modules you want to debug in Visual Studio Symbol Options
Finally, you need to disable the “Just My Code” option and enable “Source Server Support.” With these two options, Visual Studio will be allowed to debug not only your code but also go to the source server to download source files for the database information.
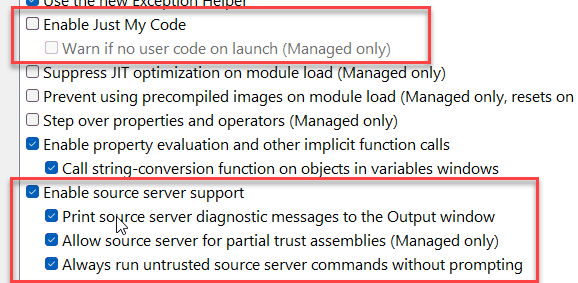
Figure 3: Configure just-my-code options to debug external code
Now you can place a breakpoint in the code where you are calling a method from an external library and if that library was published using the technique described earlier, when you press F11 you can debug the source code. What happens behind the curtains is that Visual Studio will automatically contact Azure DevOps, download the updated Program Database file, and download the exact source code to debug your function.
You are usually presented with a login form because you need to authenticate with Azure DevOps to download both the Program Database file and the source code files. Everything is protected by authentication, and no one without access to the source will be able to download the source code used to compile that library.
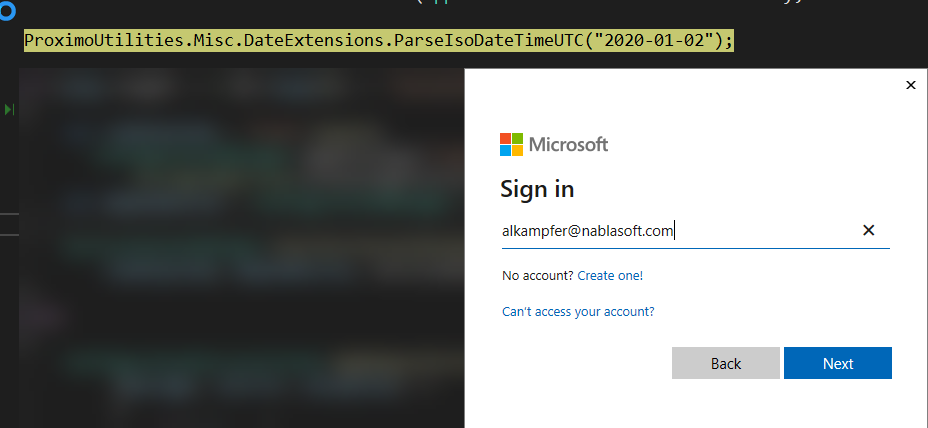
Figure 4: Configure just-my-code options to debug external code
After you have authenticated, Visual Studio will download the file and you can debug the source code as if the dll was compiled in your machine (Figure 5).
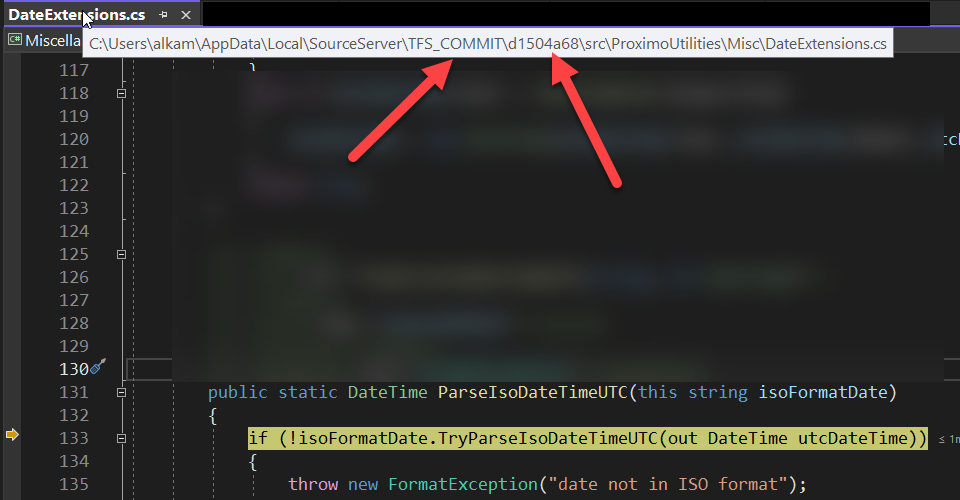
Figure 5: Debugging code of a dll in Visual Studio